OCZ Trion 100 480 GB SSD Review
Anvil Storage Utilities
Anvil Storage Utilities 1.1.0
Along with the move to a new platform, we decided to make a change in one of the benchmarks. There’s a relatively new benchmark called Anvil Storage Utilities that is in beta but close to production. It’s a very powerful tool that measures performance through a variety of tests which can be customized. Since some of the tests more or less duplicate what we get from other benchmarks we use already, we decided to use the IOPS (Input/Output Operations Per Second) testing on 4kb file sizes at a queue depth of 4, 16, and 32. IOPS performance is something SSD makers tout quite a bit but we generally don’t do a lot of IOPS testing because frankly a lot of users can’t relate to IOPS metrics as well and it tends to be more meaningful to the enterprise/server crowd. Still, it is another performance indicator with relevance and while some drives post good MB/s numbers, their IOPS scores aren’t always commensurate which this test will prove out.
Anvil SSD Benchmark with 100% Compression (incompressible data):
OCZ Trion 100 480GB:

Samsung SSD 850 EVO 500GB:
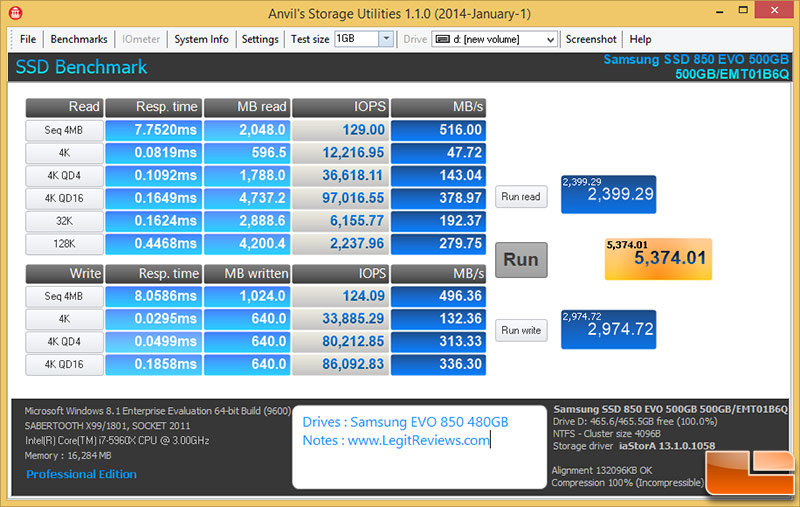
Benchmark Results: The Anvil SSD Benchmark showed that with 100% compression (incompressible data) the Samsung SSD 850 EVO 500GB drive scored 5,374 points to the 4,206 on the OCZ Trion 100 SSD. The Sequential 4MB write speeds were basically identical, but there was a huge difference at 4K QD4 as the 850 EVO had 313 MB/s and the Trion 100 had 126.83 MB/s.
Anvil SSD Applications Benchmark at 46% Compression:
OCZ Trion 100 480GB:

Samsung SSD 850 EVO 500GB:
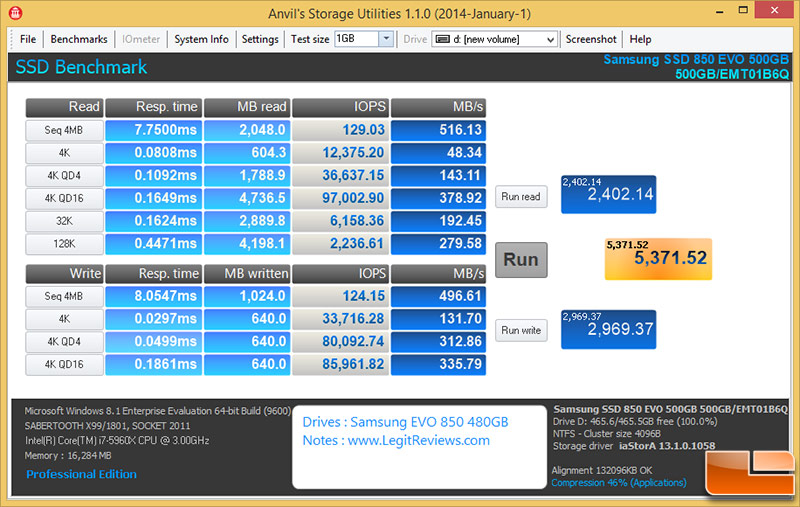
Benchmark Results: With the compression at 46% to help mimic real world applications better the performance on the OCZ Trion 100 dropped while the Samsung 850 EVO stayed more or less the same.