Samsung 850 PRO 2TB SSD Vs Samsung 850 EVO 2TB SSD
IOMeter Mixed Performance
Our mixed performance test is conducted in the same manner as our sequential tests, but once the drive is conditioned we run our test profile to look at performance in various read/write states. We start the test with 100% reads and then add write data into the mix in 10% increments until we end up with no reads at all in the workload.
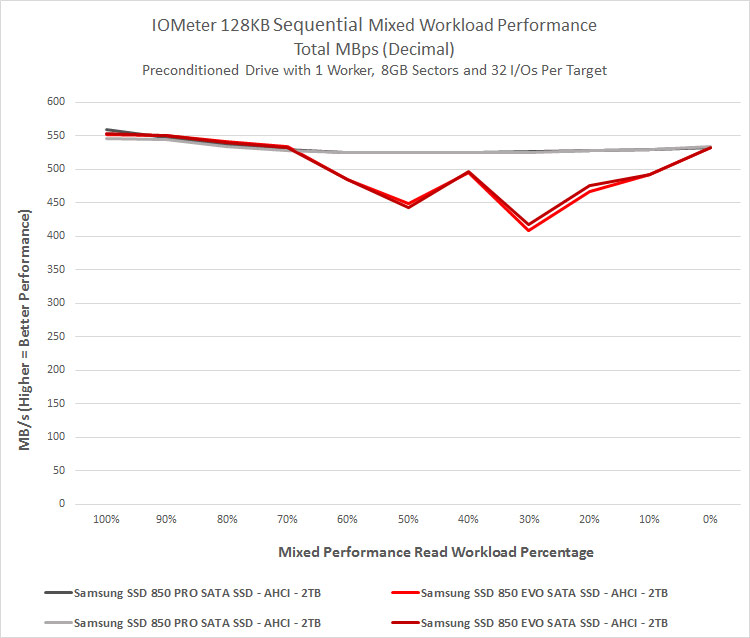
We didn’t see much of a difference between the two drives with regards to 100% read and write operations on both the 128KB sequential and 4K random tests, but we did find a difference between the two when we mixed up the workloads. We thought the results were wrong the first time, so we used Parted Magic to secure erase the drive and spent another 80 minutes pre-filling each 2TB drive in order to run the test again. After several more hours of testing we found damn near the same results. We plotted both test runs in the chart above for each drive. The Samsung SSD 850 PRO 2TB has a very slight performance drop when you begin to mix the read/write workload, but the line is nearly straight and that is impressive. The Samsung SSD 850 EVO has identical performance up until you get to 70% reads and 30% writes and then performance begins to drop off before recovering back on the 100% write test.
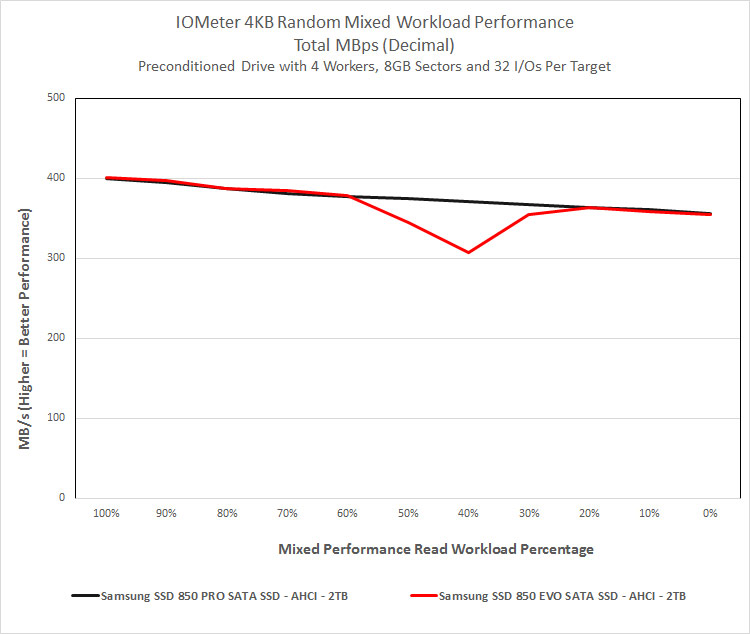
When looking at 4KB Random mixed workload performance we found both drives have performance that tapers off as the number of writes increases, but we don’t see the normal ‘bath tub’ curve on either drive. The Samsung SSD 850 EVO performance dropped off again after the 70/30 read/write test, but recovered quicker this time for some reason.
Let’s take a look at power and wrap this up!