Sabrent Rocket NVMe PCIe 4.0 1TB SSD Review
PCMark 10 Storage Benchmarks
PCMark 10
PCMark 8 was originally introduced in 2013 and the storage test uses only one thread to do everything. We are by no means living in the single-core era thanks to corporations like AMD offering CPUs with higher core counts than ever before. PCMark 10 Storage uses all the CPU cores available on the platform being tested and has been validated to support up to 5GB/s bandwidth. About half the available cores/threads are being used for generating the data needed for I/O and the other half are tasked with sending out I/Os. The I/O in both PCMark 8 and PCMark 10 is asynchronous. That means that the thread sending an I/O does not sit waiting for it to complete, but can instead queue more I/O to match the queue depth in the recorded trace. The CPU thread count used by the benchmark does not equal to the queue depth seen by the storage device. Most modern software has been written to be a muilthreaded solution where it can push IOs from multiple threads. This should play top the strengths of NVMe devices that have come out in recent years as they were designed to handle multiple queues at the same time. So, the take home message here is that PCMark 10 takes advantage of all available threads and uses newer real-world traces.
PCMark 10 – Full System Drive Benchmark Results:
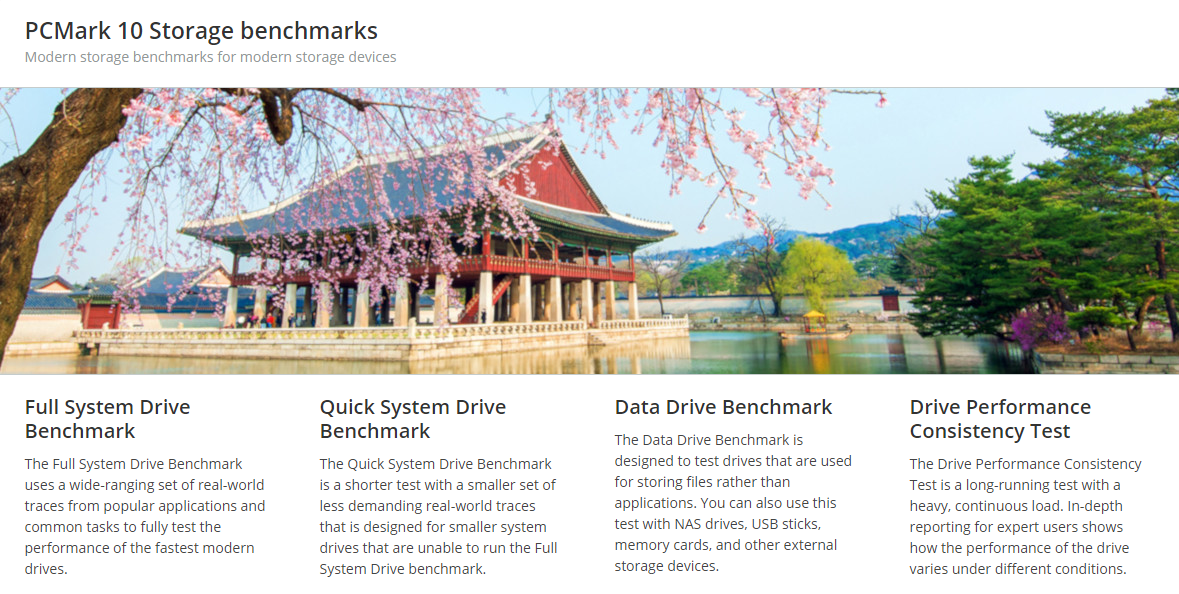
The first test that we will be running is the PCMark 10 Full System Drive Benchmark. This benchmark uses a wide-ranging set of real-world traces from popular applications and common tasks to fully test the performance of the fastest modern drives. The goal of the benchmark is to show meaningful real-world performance differences between fast storage technologies such as SATA, NVMe, and Intels Optane. The Full System Drive Benchmark uses 23 traces, running 3 passes with each trace. Some of the traces include booting Windows 10 and start times for games titles Battlefield V, Call of Duty Black Ops 4, and Overwatch. It typically takes an hour to run and the number of bytes written to the drive during test with default settings is 204 GB.
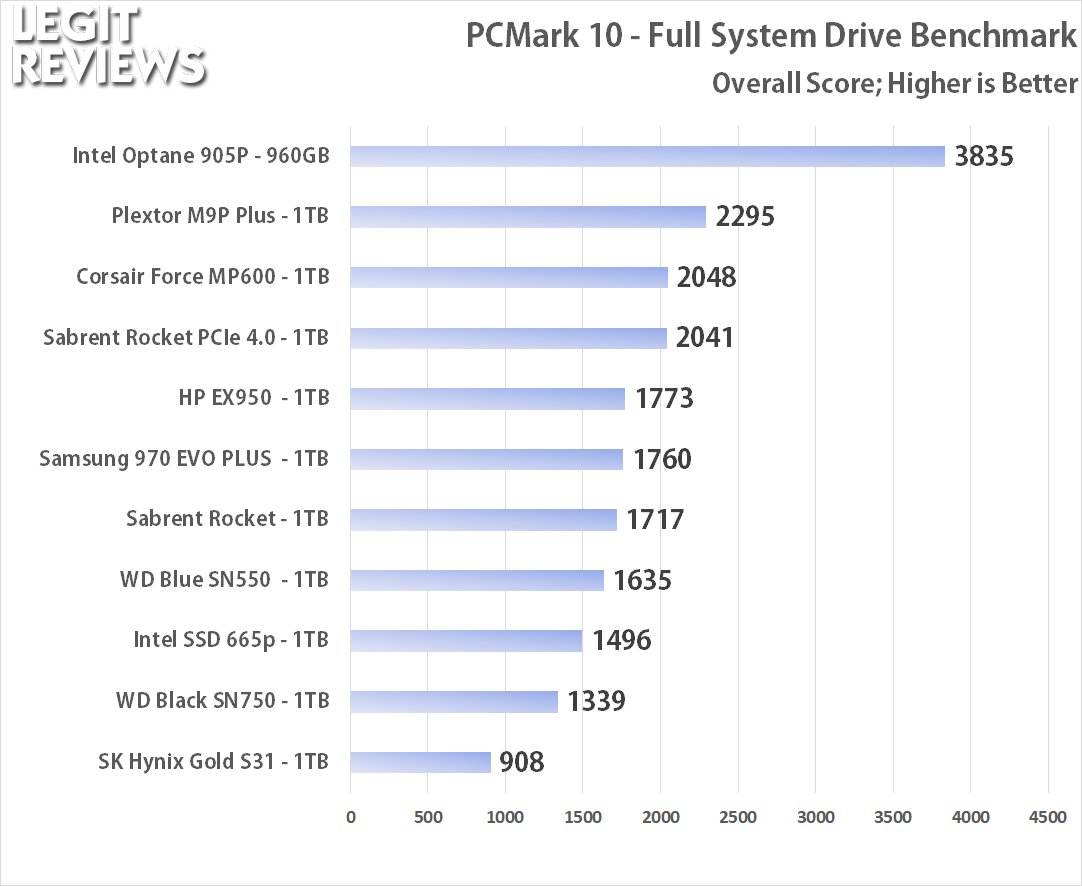
On the full system drive benchmark the results show the Intel Optane 905P 960GB drive dominating the other drives as it should since it is the highest priced drive of the group. The Plextor M9P Plus (PX-1TM9PG+) at $134.99 does extremely well on this benchmark as it was able to top the Corsair Force MP600. The Corsair Force MP600 and Sabrent Rocket NVMe PCIe 4.0 are the only two PCIe Gen 4.0 x4 drive of the group and are in a virtual tie for 3rd place.
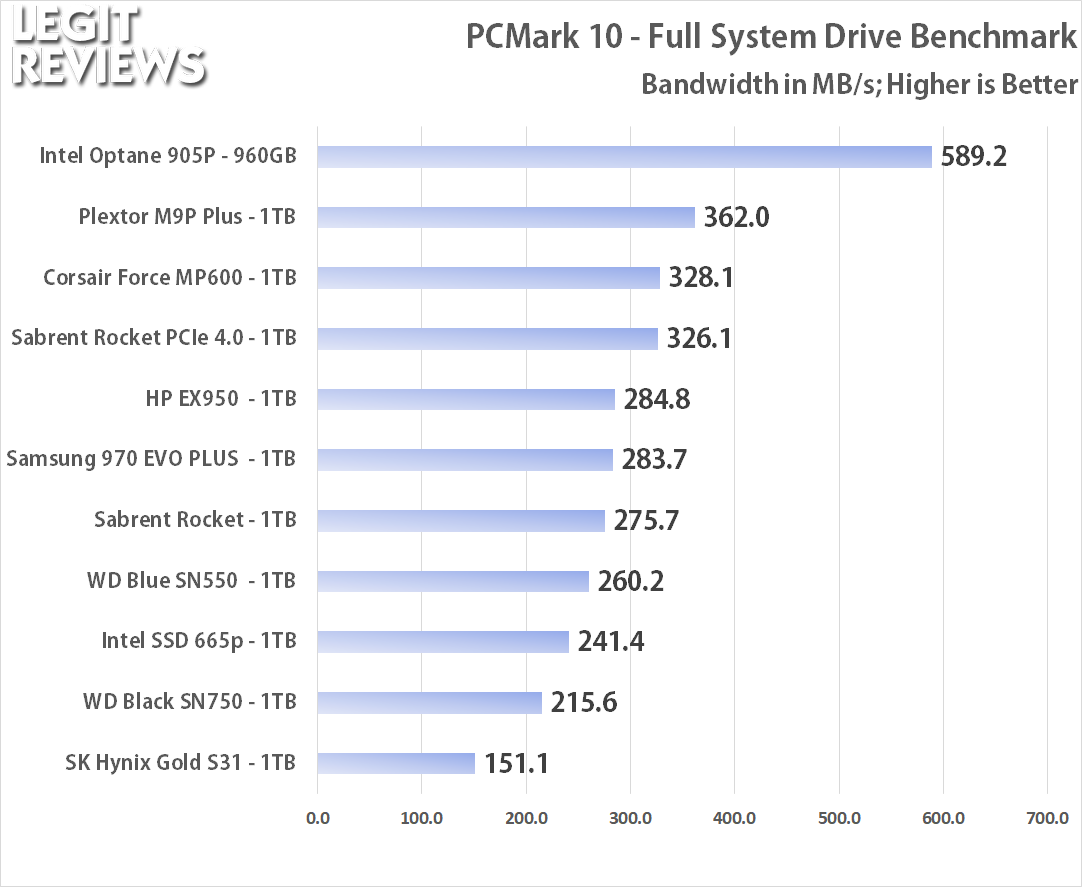
The PCMark 10 Storage Benchmarks overall score is calculated from the bandwidth and average access time sub-scores. The bandwidth subtest is defined by UL in PCMark 10 as bandwidth = bytes / busy_time_for_read_and_write. Here we see nice scaling as the SATA III drive got around 150 MB/s, the NVMe drives running traditional NAND Flash were around 200-400 MB/s and then the only 3D Xpoint drive of the group was pushing close to 600 MB/s. The Sabrent Rocket NVMe 4.0 came in with a bandwidth result of 326.1 MB/s.
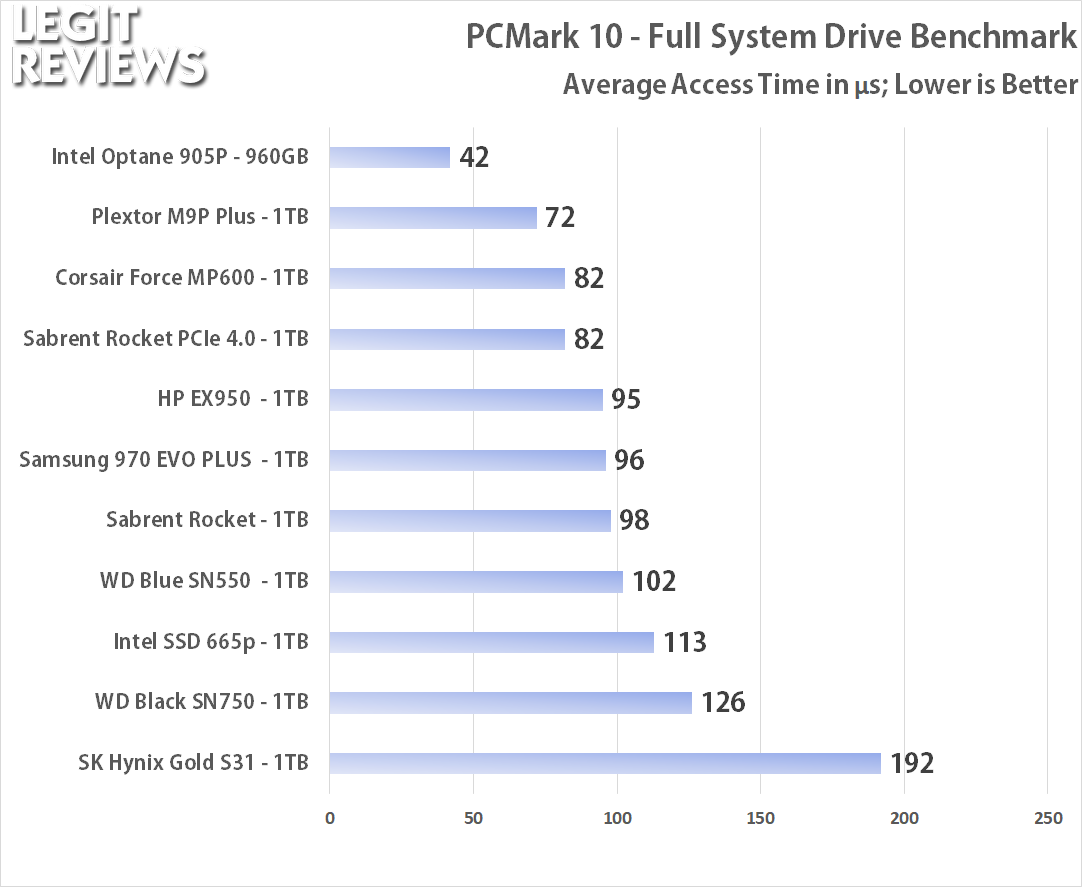
The final subtest result is the average access time. During a trace playback in PCMark 10, the start and end time is measured for each I/O. So, the average access time is derived from the end time of an I/O subtracted from the start time of that operation. The Sabrent Rocket NVMe 4.0 drive had an average access time of 82 microseconds.
PCMark 10 – Quick System Drive Benchmark Results:
The second and final test that we will be running is the PCMark 10 Quick System Drive Benchmark. The Quick System Drive Benchmark is a shorter test with a smaller set of less demanding real-world traces. This benchmark is better suited for testing entry performance
level and lower capacity drives in less demanding use scenarios. The benchmark is designed to measure the performance of small system drives from traditional spinning drives (HDDs) at the low end and entry-level PCI Express SSDs at the high end. The Quick System Drive Benchmark uses 6 traces, running 3 passes with each trace. Three of the traces involve copying JPEG images and the other three use Microsoft Excel, Adobe Illustrator, and Adobe Photoshop. It typically takes 20 minutes to run and the number of bytes written to the drive during test with default settings is 23 GB.
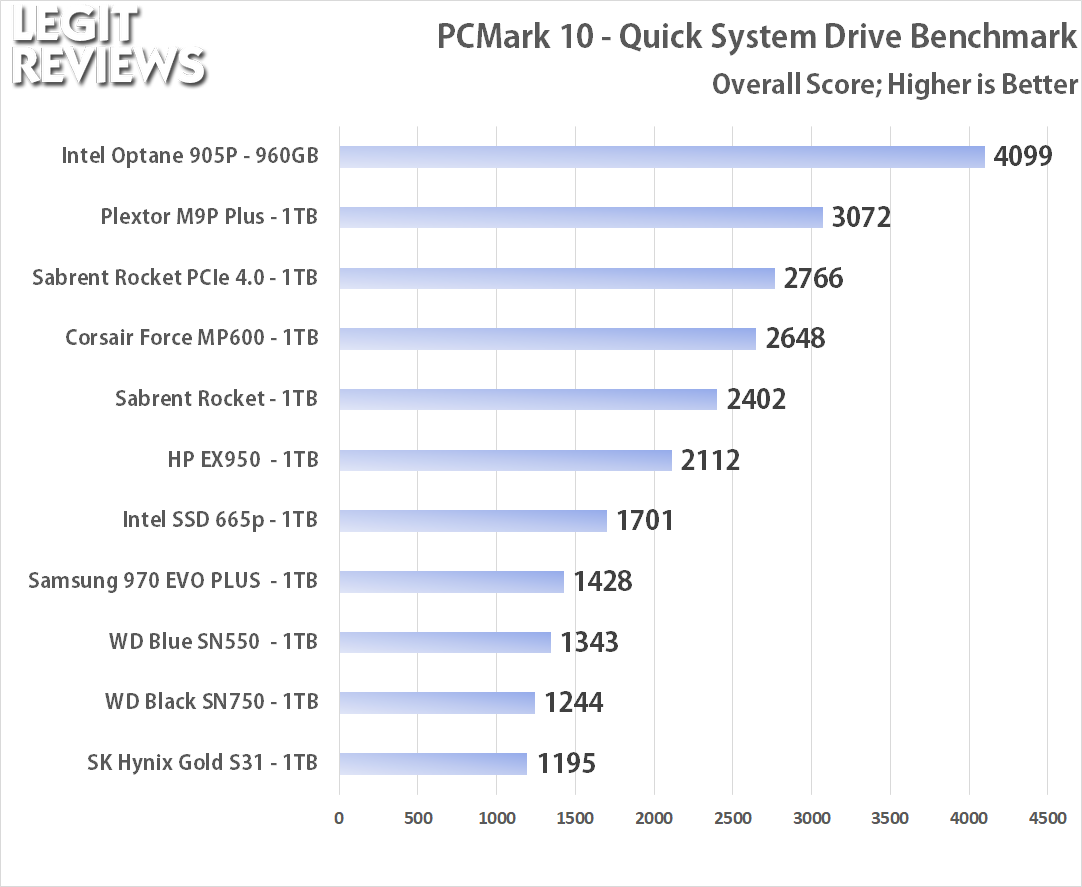
The results here are mostly the same on the top and bottom, but we do see some drives perform differently in the middle. The Sabrent Rocket NVMe PCIe 4.0 drive finished in 3rd place again in this benchmark. We witnessed a larger performance gap between that drive and the Corsair MP600, but the difference is under 5% and could possibly be due to the fact that each drive is running a different firmware revision.
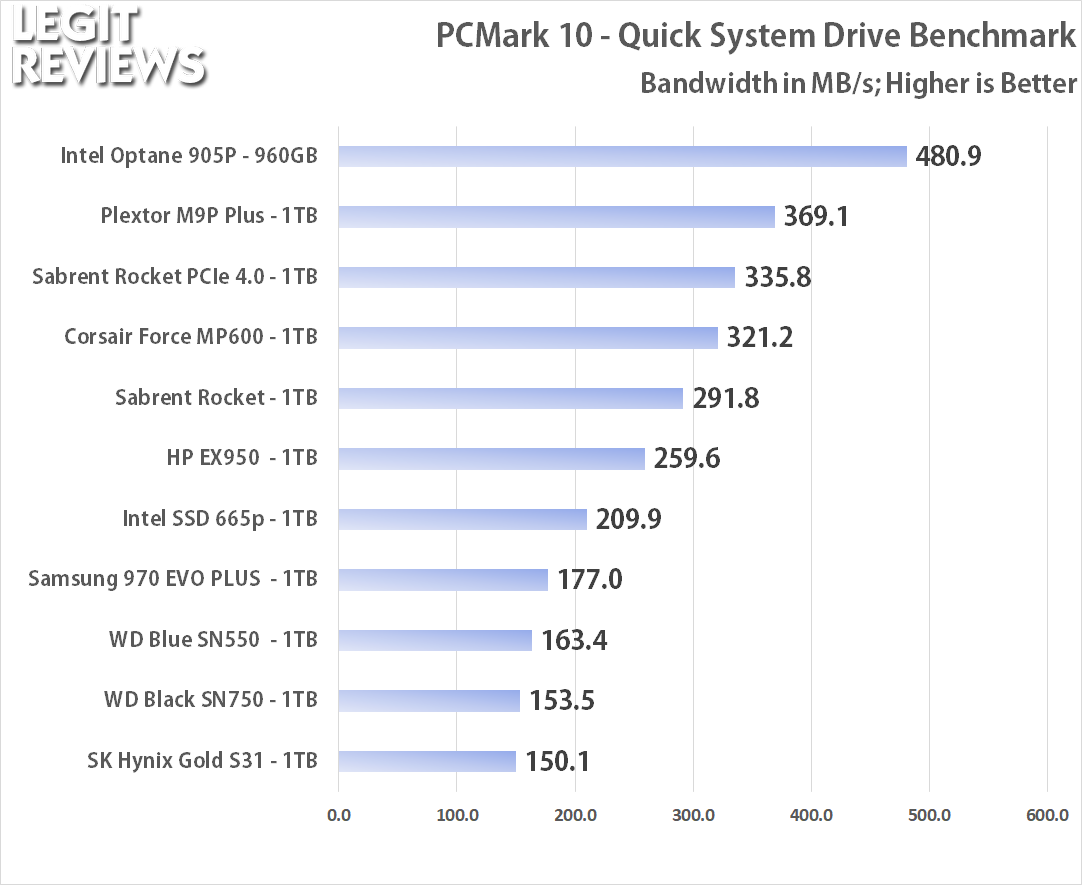
The Sabrent Rocket 4.0 does really well in the bandwidth test with a result of 335.8 MB/s.
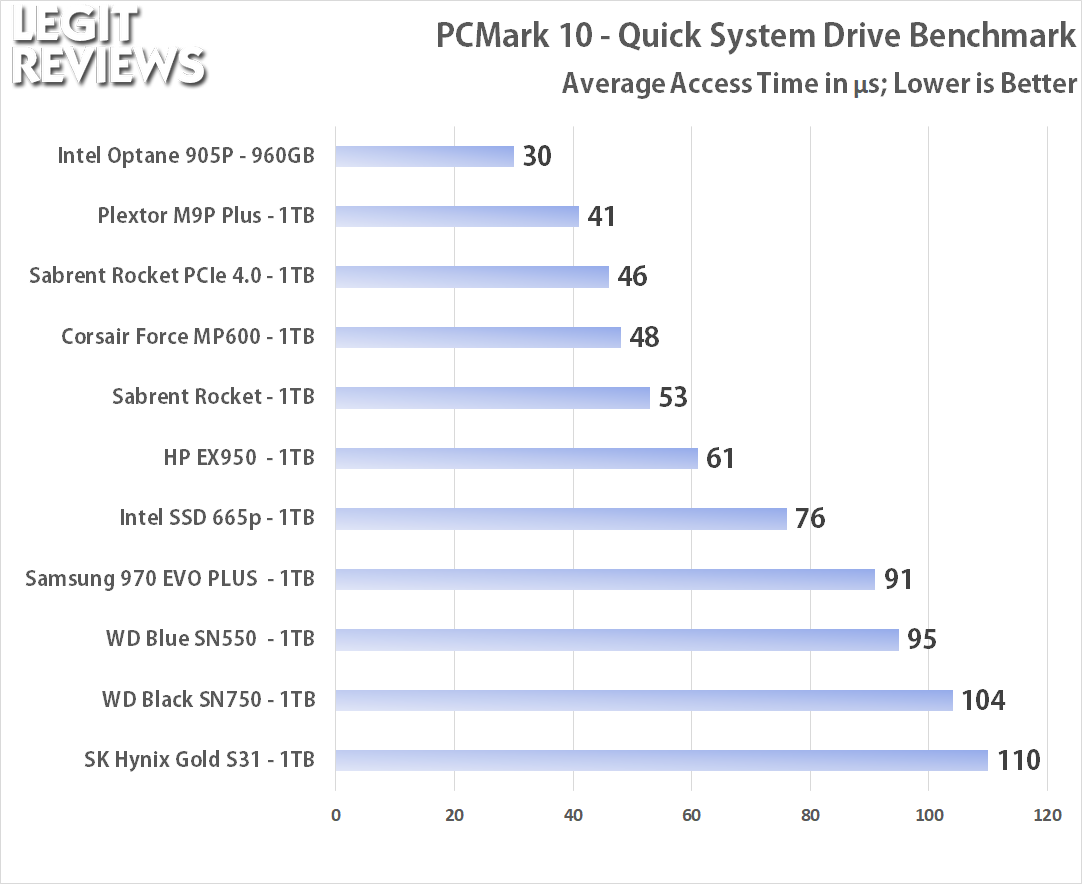
The average access times were lower on the PCMark 10 Quick System Drive benchmark and show some great scaling as you can see from the table above.