NVIDIA GF100 Fermi Architecture and Performance Preview
GF100 Performance Numbers
Now that the architecture and general features have been gone over we can take a look at some performance numbers! NVIDIA had a pair of identical demo systems setup for us to see the performance difference between a GeForce GTX 285 graphics card and a GF100 Fermi. The first benchmark that we will be looking at is the built-in benchmark that comes with Far Cry 2. We don’t have the exact specifications on the test systems, we did figure out that they were running an Intel i7 960 processor at 3.2GHz, 6GB of 1600Mhz memory and an ASUS Rampage II Extreme motherboard running Windows 7 Ultimate 64-bit.
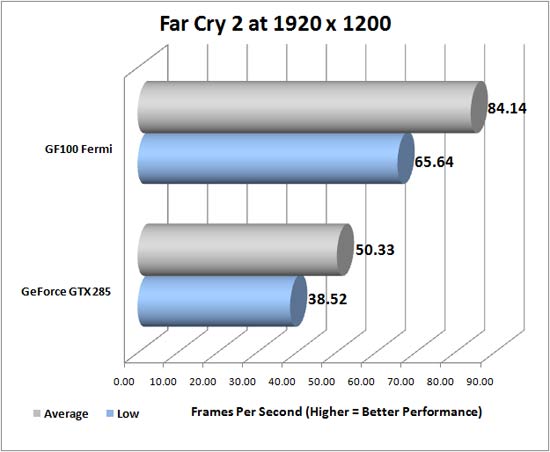
Listen to Lars from NVIDIA talk about the Far Cry 2 Benchmark as it runs on a GF100 and a GTX285 graphics cards in side by side test systems. The benchmark was run at a resolution of 1920 x 1200 with ultra high image quality settings, 4x AA and HDR enabled. The final results can be seen in the chart below.

The average FPS was 84FPS on the GF100 and 50FPS on the GTX285. Not bad for ultra high image quality at 1920×1200. From this benchmark we can see that a single GF100 prototype card is ~67% faster than a single GeForce GTX 285 on average.
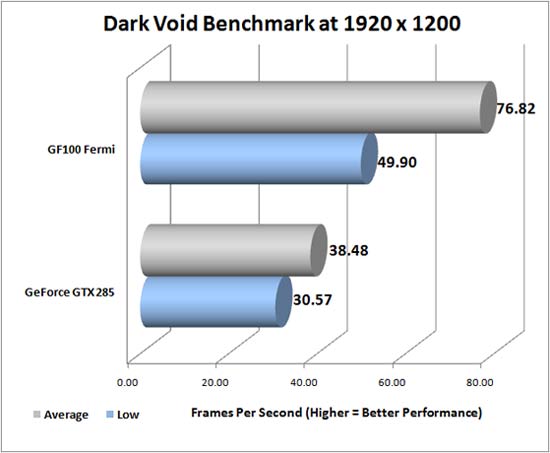
Once again in this video clip you can hear Lars from NVIDIA talk about the Dark Void Benchmark as it runs on a GF100 and a GTX285 graphics cards in side by side test systems. He claims that the Dark Void benchmark is more of a compute benchmark than anything, so let’s take a look at this test.

In the PC Game Dark Void the average FPS was 77FPS on the GF100 prototype video card and 38FPS on the NVIDIA GeForce GTX 285 at a resolution of 1920×1200. From this benchmark we
can see that a single GF100 prototype card is nearly twice as fast when compared to a single GeForce GTX 285 when it comes to the average frame rate!

Comments are closed.