Kingston HyperX Blu 1600MHz 16GB (2x8GB) Memory Kit Review
Sandra, H264 HD and 3DMark11 Benchmarks
DDR3 Memory Speed Performance
On this page you’ll see results of HyperX Predator 8GB (2x4GB) dual channel memory kit at 1600MHz with CL9 timings and then at 2400MHz & 2666MHz with the XMP profile settings.
SiSoftware Sandra 2012 SP5a:
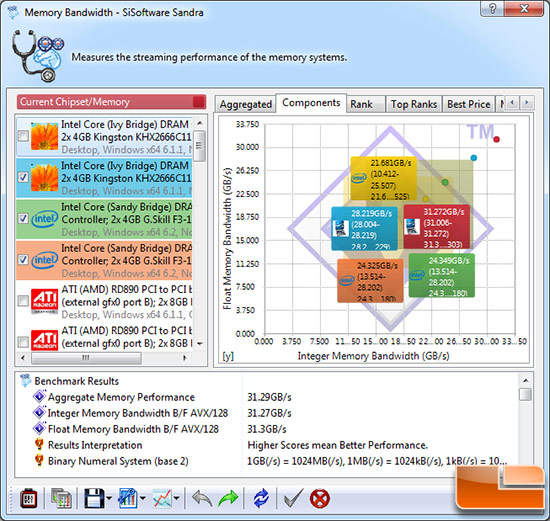
The Sisoft Sandra 2012 SP5a benchmark utility just came out and we have started to include it in our benchmarking.
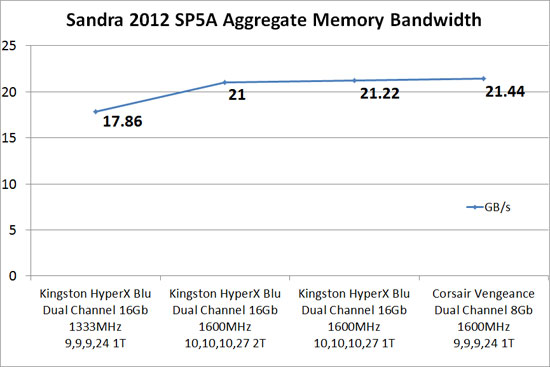
Results: The aggregate memory performance between the different memory kits and timings didn’t surprise us. The Corsair Vengeance kit has a slight edge due to running at 1600MHz and 9,9,9,24 1T timings, instead of the 10,10,10,27 1T timings that the Kingston HyperX Blu 16Gb kit runs at. The difference that we saw at 1T and 2T timings on the Kinston HyperX Blu modules was only .22Gb/s. The biggest difference was between the Kingston HyperX Blu kit running at 1600MHz 10,10,10,27 1T and running the default speed of 1333MHz 9,9,9,24 1T. At the default speed and timing the Kingston HyperX Blu 16Gb kit had an aggregate performance of 17.86GB/s while when set to the rated speeds of 1600MHz 10,10,10,27 1T we saw a jump in performance up to 21.22GB/s.
x264 HD Encoding Benchmark v5.0.1 64-Bit

Simply put, the x264 HD Benchmark is a reproducible measure of how
fast your machine can encode a short HD-quality video clip into a high
quality x264 video
file. It’s nice because everyone running it will use the same video clip
and software. The video encoder (x264.exe) reports a fairly accurate
internal benchmark (in frames per second) for each pass of the video
encode and it also uses multi-core processors very efficiently. All
these factors make this an ideal benchmark to compare different
processors and systems to each other. We are using x264 HD v5.0.1 for this test.

Results: The
memory clock speed plays a small roll in performance here on the x264 HD benchmark. The only significant gains that we can see are between the Kingston HyperX Blu memory kit running at 1333MHz and the increase to 1600MHz on the first pass. The Kingston HyperX Blu running at 1333MHz averaged 67.12 frames per second on the first past while at 1600MHz 1T timings it jumped to 68.02 frames per second, not a huge difference but it is measurable.
3DMark 11

3DMark 11 is the latest version of the worlds most popular benchmark for measuring the 3D graphics performance of gaming PCs. 3DMark 11 uses a native DirectX 11 engine designed to make extensive use of all the new features in DirectX 11, including tessellation, compute shaders and multi-threading.

We ran Futuremark 3DMark11 with the default performance presets on the AMD Radeon HD 7950 video card to see how our hardware will run.

Results: The
overall 3DMark score ranged from 7129 to 7168 with slight increases at each step. As expected the largest performance increase was between 1333MHz and 1600MHz. Running the Kingston HyperX Blu memory at 1333MHz our system scored 7129 3DMarks, increasing the memory frequency to 1600MHz we saw a jump of 28 points. Dropping from 2T to 1T gave us another increase of 10 3DMarks to our overall. Looking at the physics scores in 3DMark 11 the differences are much more exaggerated. At 1333MHz we had a physics score of 9256, 1600MHz 2T timings we saw a score of 9524, and 1T timings jumped another 45 points for a total score of 9569.
Comments are closed.