Samsung 850 EVO mSATA and M.2 SSD Review
CrystalDiskMark & Anvil IOPS
CrystalDiskMark is a small benchmark utility for drives and enables rapid measurement of sequential and random read/write speeds. Note that CDM only supports Native Command Queuing (NCQ) with a queue depth of 32 (as noted) for the last listed benchmark score. This can skew some results in favor of controllers that also do not support NCQ.
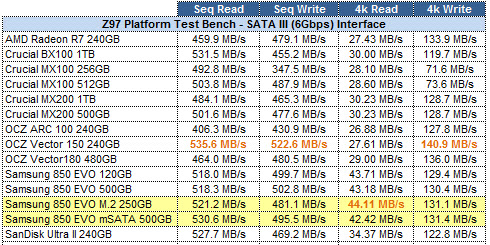
CrystalDiskMark 3.0.3 x64 – Intel Z97 Platform
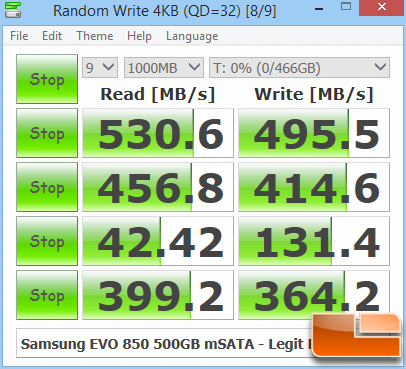
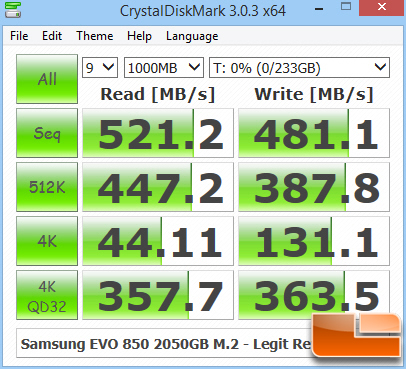
Benchmark Results: The M.2 drive shows just a little less here than the mSATA but not by much and this is likely a manifestation of just having two NAND modules in the array as opposed to the four on the mSATA.
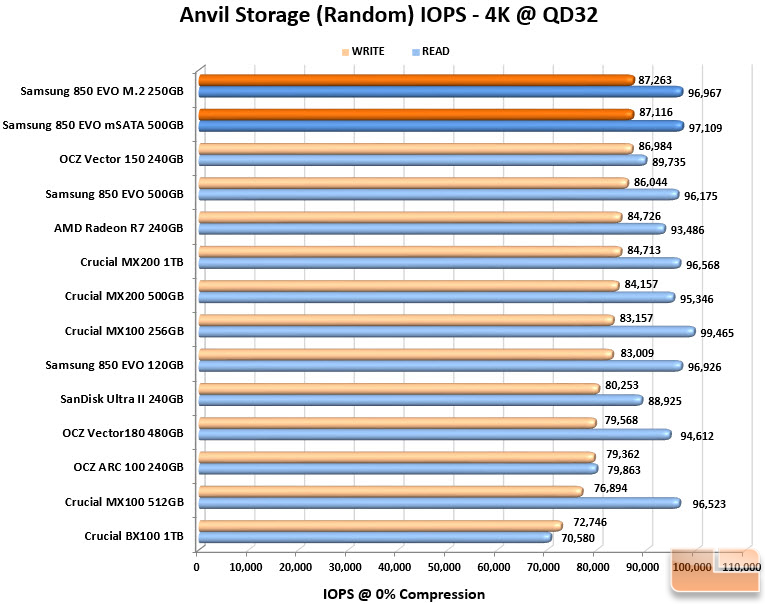
Anvil Storage Utilities is a very powerful tool that measures performance through a variety of tests which can be customized. Since some of the tests more or less duplicate what we get from other benchmarks we use already, we decided to use the IOPS (Input/Output Operations Per Second) testing on 4kb file sizes at a queue depth of 32. IOPS performance is something SSD makers tout quite a bit but we generally don’t do a lot of IOPS testing because frankly a lot of users can’t relate to IOPS metrics as well and it tends to be more meaningful to the enterprise/server crowd. Still, it is another performance indicator with relevance and while some drives post good MB/s numbers, their IOPS scores aren’t always commensurate which this test will prove out.


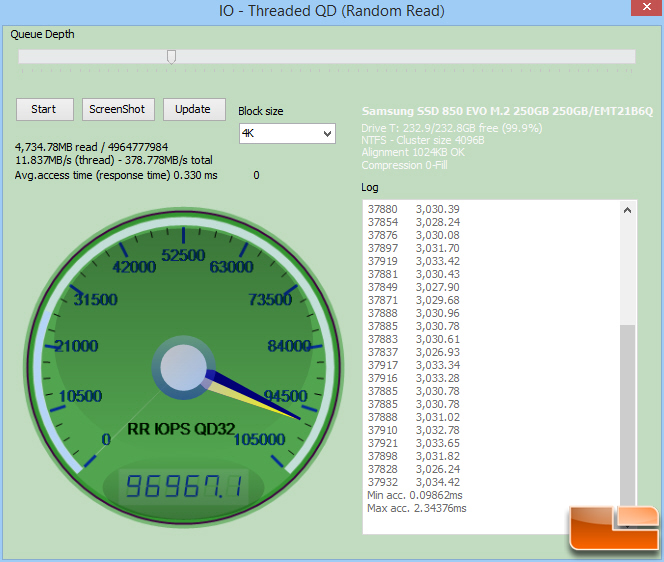
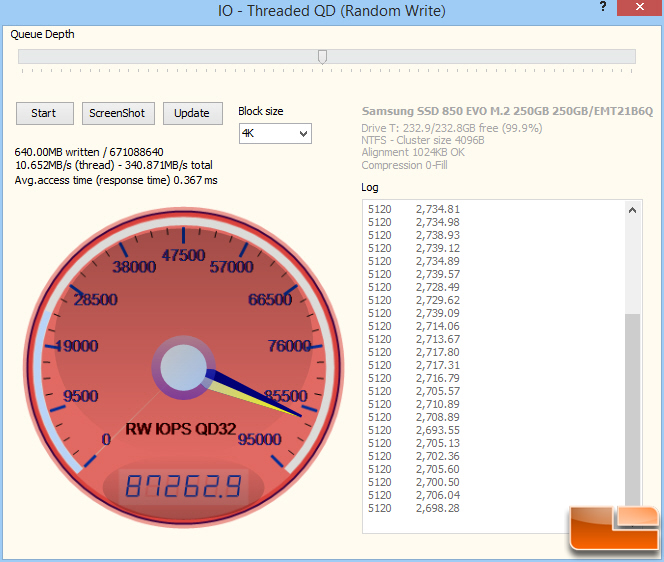
Benchmark Results: IOPS performance is for all intents and purposes, identical between the mSATA and M.2 drives and even the 2.5″ version.