Intel SSD Pro 2500 Series 240GB Enterprise SSD Review
PCMark 8 Consistency Test
Something new we are starting to do is run the storage consistency test in the PCMark 8 application from Futuremark. In short, it looks at drive performance degradation as the drive becomes “dirty” and how it rebounds after given time to recover and run background routines like garbage collection and TRIM. This takes nearly a day to run through all of the iterations of test sets. Since most of our benchmarks show the drive performance in a clean state, this is a nice contrast to provide yet another view of performance. PCMark 8’s storage benchmark test contains workload traces from Adobe Photoshop, Adobe Illustrator, Adobe InDesign, Adobe After Effects, Microsoft Word, Microsoft Excel, Microsoft Power Point, World of Warcraft and Battlefield 3.
The PCMark 8 Consistency test has five phases:
Precondition phase
- Write the drive sequentially through up to the reported capacity with random data.
- Write it through a second time (to take care of overprovisioning).
Degradation phase
- Run writes of random size between 8*512 and 2048*512 bytes on random offsets for 10 minutes.
- Run performance test (one pass only). The result is stored in secondary results with name prefix degrade_result_X where X is a counter.
- Repeat 1 and 2 for 8 times and on each pass increase the duration of random writes by 5 minutes
Steady state phase
- Run writes of random size between 8*512 and 2048*512 bytes on random offsets for final duration achieved in degradation phase.
- Run performance test (one pass only). The result is stored in secondary results with name prefix steady_result_X where X is a counter.
- Repeat 1 and 2 for 5 times.
Recovery phase
- Idle for 5 minutes.
- Run performance test (one pass only). The result is stored in secondary result with name recovery_result_X where X is a counter.
- Repeat 1 and 2 for 5 times.
Clean up
- Write the drive sequentially through up to the reported capacity with zero data.
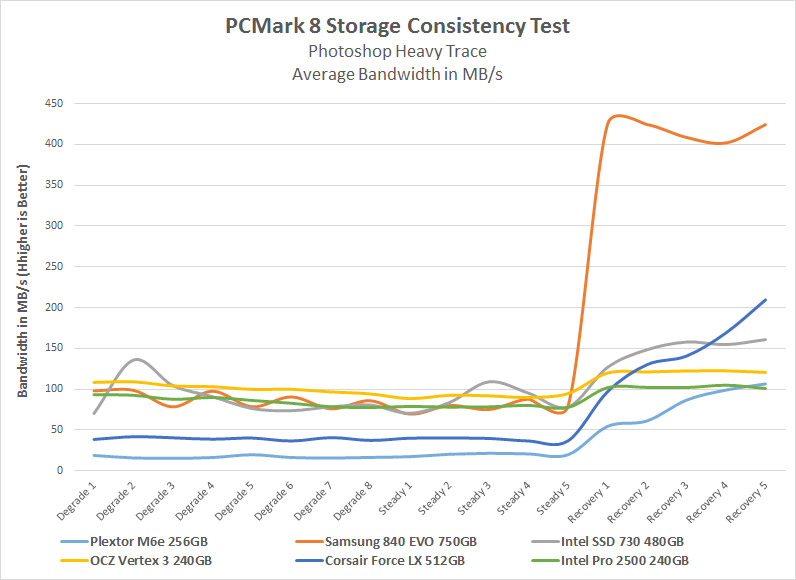
Benchmark Results: There is a pretty significant difference between rives when it comes to performance in a optimized TRIM state versus a heavily used state without the time needed to execute the TRIM command. The chart above looks at the Photoshop Heavy Trace test scenario. The Intel SSD 730 480GB drive and Intel SSD Pro 2500 240GB were similar in the worst-case dirty/degraded states, but the Intel SSD 730 480GB drive pulled ahead when it was given time to recover. The OCZ Vertex 3 240GB SSD was one of the very first SandForce 2281 drives to come out in 2011 and you can see that the original Vertex 3 240GB SSD is still competitive today. The Intel SSD Pro 2500 series 240GB drive is a business-class drive, so it isn’t a big surprise that it doesn’t lead the benchmarks as this drive is more about reliability and having enough overall performance that business users aren’t complaining about poor drive performance.
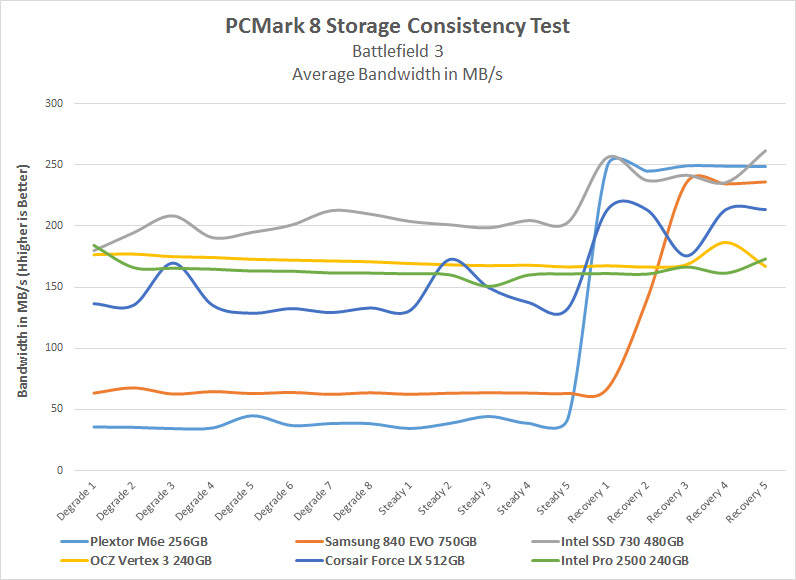 Benchmark Results: Gaming performance might not be the best test case for a business-class SSD, but even white collar professions game. The chart above shows detailed Battlefield 3 test results, which are clearly different than what we saw with Photoshop Heavy Trace. The Plextor M6e M.2 PCIe drive is the fastest on paper, but it performed the worst in a degraded state and the best of all the drives when recovered. The Samsung 840 EVO 750GB drive went from doing great in a degraded state and the best in a recovered state went to the second worst in a degraded state and third best in a recovered state. The Intel SSD Pro 2500 240GB was found to be just a tad slower than the OCZ Vertex 3 240GB drive.
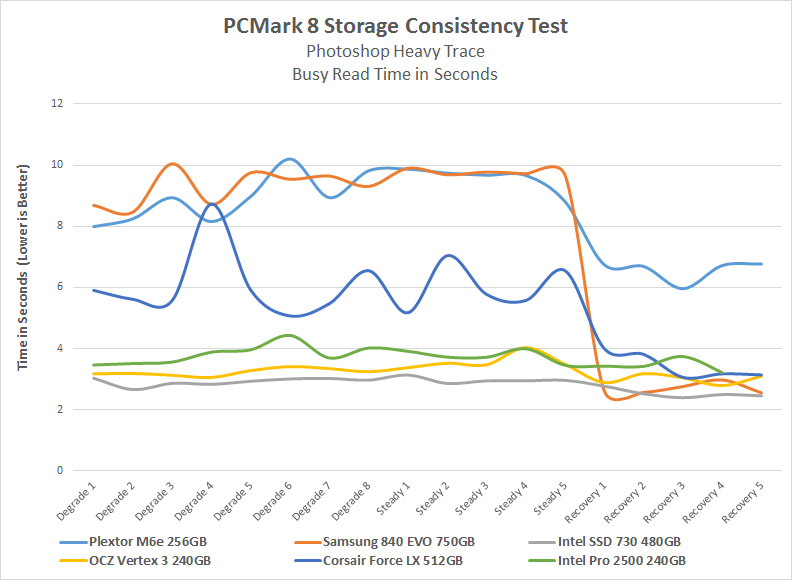
Benchmark Results: This chart looks at the total busy time that the drives are doing the read test in the Photoshop Heavy Trace workload. The lower the time the better and you can see the Intel SSD 730 480GB does the best when it comes to this specific workload with the older OCZ Vertex 3 240GB SSD not too far behind. The Intel SSD Pro 2500 240GB SSD has very good Busy Read times.
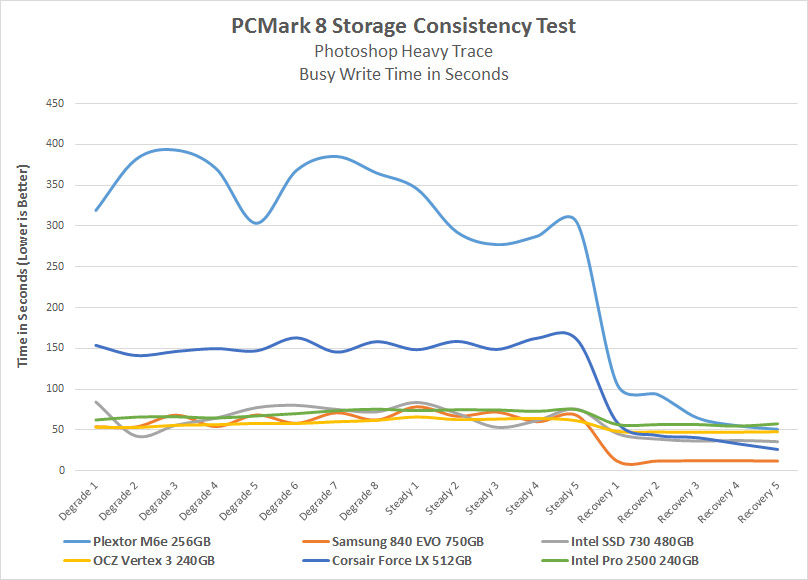
Benchmark Results: This chart looks at the total busy time that the drives are doing the write test in the Photoshop Heavy Trace workload. The lower the time the better and you can see the Intel Pro SSD 2500 240GB drive was in the mix albeit on the slower side.