Benchmarking The Core 2 Extreme QX6700 Processor
Futuremark: PCMark05 and 3DMark06
PCMark05 (Build 1.1.0) Benchmarking –
PCMark 05 is sold as being everything you need to reliably and easily measure the performance of your PC and determine its strengths and weaknesses. With PCMark05, you will be able to select the optimal upgrades for your existing PC, or choose the right new PC that fits your specific needs. The CPU test suite is a collection of tests that are run to isolate the performance of the CPU. The CPU Test Suite also includes multithreading: two of the test scenarios are run multithreaded; the other including two simultaneous tests and the other running four tests simultaneously. The remaining six tests are run single threaded. Operations include, File Compression/Decompression, Encryption/Decryption, Image Decompression, and Audio Compression.
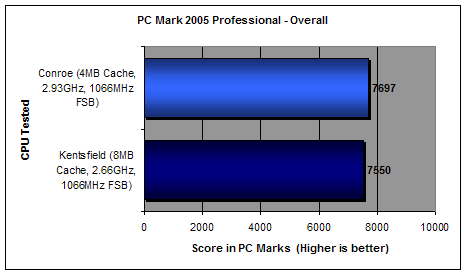
It was interesting to see that Conroe actually beat out Kentsfield in this benchmark, but Intel tried to explain that the tests are weighted differently in the application that that is was understandable to see these scores.
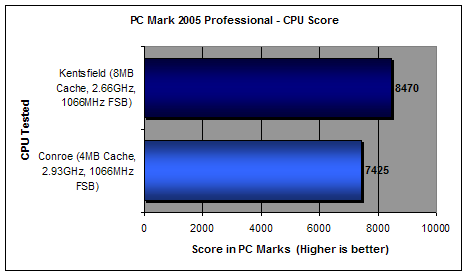
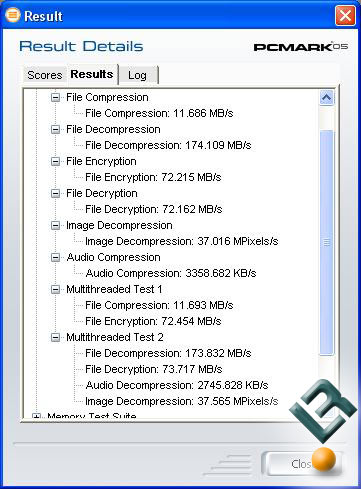
Looking at the closer at the CPU we see that it actually beats Conroe by a long shot, so with identical systems and Kentsfield losing the overall performance test and winning the CPU test we have no clue on how to explain this one. If you would like to run PCMark05 on your own system and would like to compare your single or dual-core processor to a quad-core system here are the detailed test results from our 2.66GHz quad-core processor.
3DMark06 (Build 1.1.0) Benchmarking –
3DMark06 includes an array of 3D graphics, CPU and 3D feature tests for overall performance measurement of current and future PC gaming systems. With this broader design approach, 3DMark06 has become the benchmark of choice for all PCs with top-of-the-line graphics hardware and CPUs. 3DMark06 is the first product from Futuremark using the AGEIA PhysX software physics library in two very complex, game-like threaded CPU tests conceived to measure properly performances of single processor, multi-core and multiple processor systems in next generation of games. In addition to using real-time physics, both CPU tests also employ multi-threaded artificial intelligence algorithms. By combining the results of the two CPU tests and four graphics tests, 3DMark06 enables users to get a 3DMark score which reflects the overall gaming performance of their PC.
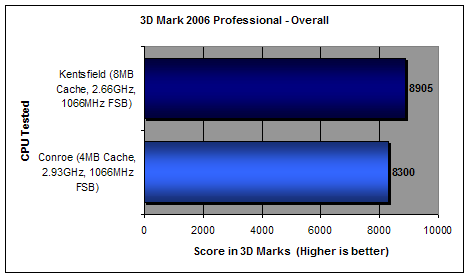
In 3DMark06 the overall score improved with quad-core by over seven percent thanks to the additional cores.
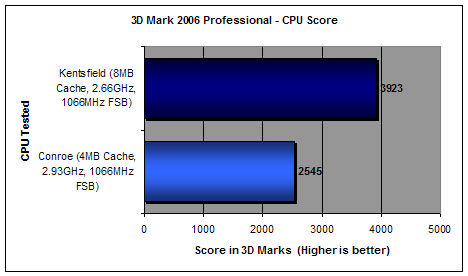
Looking at the CPU socre we see that Kentsfield is 54% faster than Conroe! The CPU test is actually averaging above a frame per second with Kentsfield. If you have 3DMark06 feel free to compare your testing numbers to our detailed results shown below.
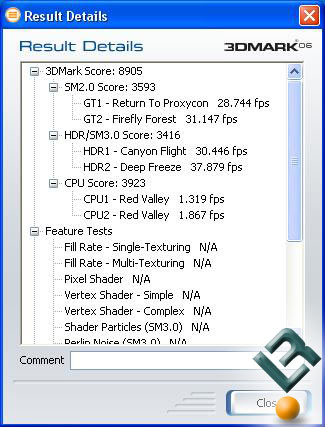
To sum up PCMark05 and 3DMark 06 we saw CPU benchmarking tests increase 14% and 54% respectively. These gains are nice, but let’s keep looking at other benchmarks.

Comments are closed.