WD Blue SN500 250GB NVMe SSD Review
ATTO – CrystalDiskMark – Anvil
ATTO v4.00.0f2
ATTO is one of the oldest drive benchmarks still being used today and is still very relevant in the SSD world. ATTO measures transfers across a specific volume length. It measures raw transfer rates for both reads and writes and places the data into graphs that can be very easily interpreted. The test was run with the default runs of 0.5KB through 64MB transfer sizes with the total length being 256MB.
ATTO – WD SN500 250GB:
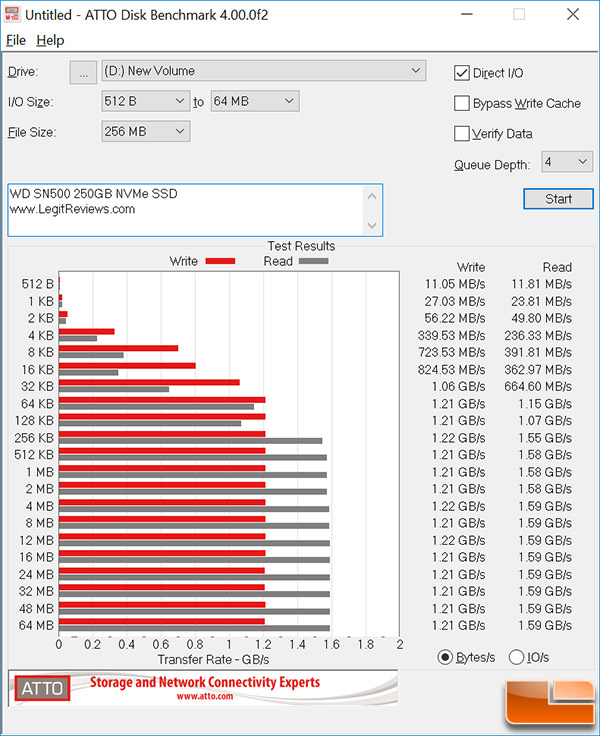
Benchmark Results: ATTO showed the WD SN500 250GB M.2 NVMe drive reaching speeds of up to 1.59 GB/s read and 1.21 GB/s write in the standard overlapped I/O benchmark. This is just below the drives 530 MB/s max sequential read and 500 MB/s max sequential write speeds.
CrystalDiskMark 6.0.2 x64
CrystalDiskMark is a small benchmark utility for drives and enables rapid measurement of sequential and random read/write speeds. Note that CDM only supports Native Command Queuing (NCQ) with a queue depth of 32 (as noted) and shows the highest score of five runs.
CystalDiskmark – WD SN500 250GB:
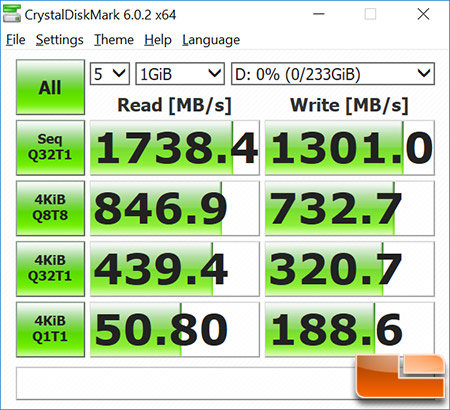
Benchmark Results: When it comes to performance in CrystalDiskMark v6.0.2 we managed to hit 1,738 MB/s in the sequential read and 1,301 MB/s in the sequential write test. The WD Blue SN500 250GB NVMe SSD is rated as having up to 1,700 MB/s read and 1,300 MB/s write and we were able to just barely exceed both of those values. The Random 4K performance at a Queue Depth (QD) of 1 was 50.8 MB/s read and 188.6 MB/s write.
Anvil Storage Utilities 1.1.0
Along with the move to a new platform, we decided to make a change in one of the benchmarks. There’s a relatively new benchmark called Anvil Storage Utilities that is in beta but close to production. It’s a very powerful tool that measures performance through a variety of tests which can be customized. Since some of the tests more or less duplicate what we get from other benchmarks we use already, we decided to use the IOPS (Input/Output Operations Per Second) testing on 4kb file sizes at a queue depth of 1, 4, 8, 16, 32, 64 and 128. IOPS performance is something SSD makers tout quite a bit but we generally don’t do a lot of IOPS testing because frankly a lot of users can’t relate to IOPS metrics as well and it tends to be more meaningful to the enterprise/server crowd. Still, it is another performance indicator with relevance and while some drives post good MB/s numbers, their IOPS scores aren’t always commensurate which this test will prove out.
Anvil SSD Benchmark with 46% Compression (incompressible data):
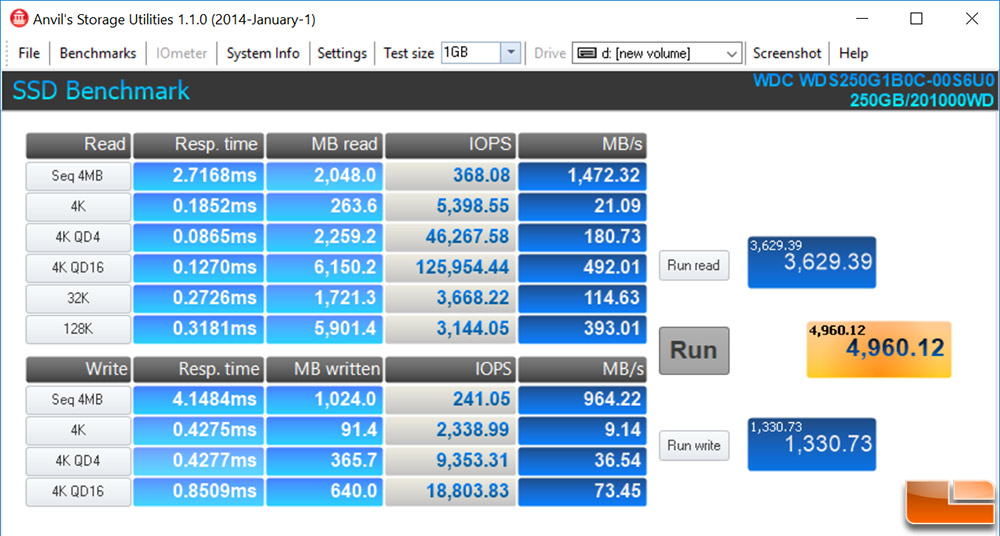
Benchmark Results: Another benchmark we like to run is Anvil’s Storage Utilities 1.1.0 and in that benchmark we got an overall score of 4,960 points when running the benchmark in applications mode (46% compression). Random 4K performance at a QD of 16 was shown to be just 126,000 IOPS read and 18,800 IOPS write.