NVIDIA SHIELD Set-Top Console Benchmarks
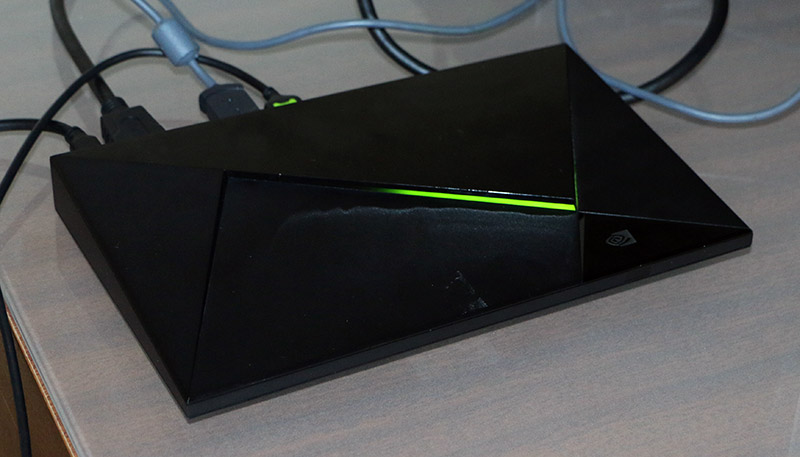
Earlier this week, NVIDIA announced that the Tegra X1 processor would be powering the company’s first set-top box aimed at living room, with the announcement of the NVIDIA Shield console. The SHIELD will run Android TV and act as a do it all device that will allow you to play games, watch videos and connect to the GRID streaming service among other things. With an MSRP of $199 and availability in May, the SHIELD Set-Top box has grabbed the attention of many this week.
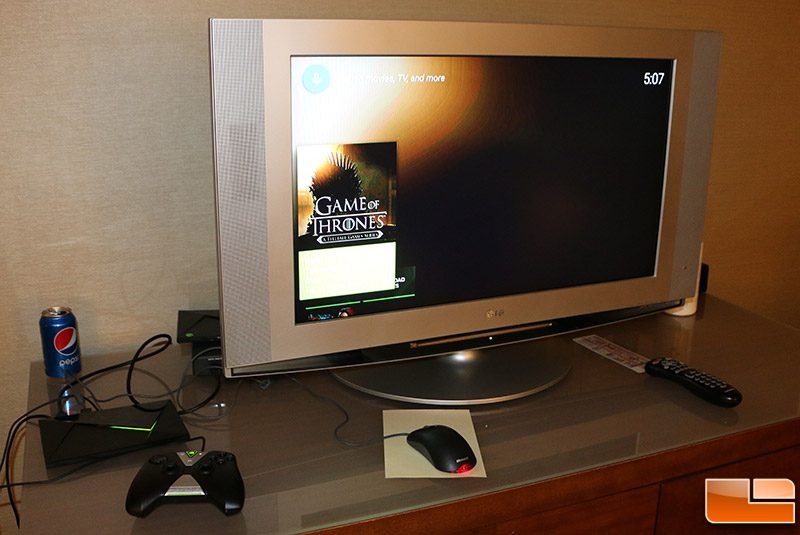
The NVIDIA SHIELD Set-Top is powered the Tegra X1 processor, which has 8-cores based on the ARM big.LITTLE Cortex-A57/A53 design that is built by TSMC on the 20-nm manufacturing process. The graphics inside the SoC are of course designed by NVIDIA and you’ll find a 256-core ‘Maxwell’ GPU that creates a pretty potent little chip that should blaze through the daily tasks of a set-top console. The benchmarks out on the web that show off the true performance numbers behind the NVIDIA SHIELD console are far and few between, so we managed to track done some NVIDIA employees and get some 1-on-1 time with an early sample of the NVIDIA SHIELD to run some benchmarks on it. The LG HDTV we were using the hotel was pushing being a decade old, but we were able to get the NVIDIA SHIELD connected to it and working with the early hardware and drivers. No easy feat seeing how this device won’t be out until May and that is a long time away when it comes to driver enhancements.
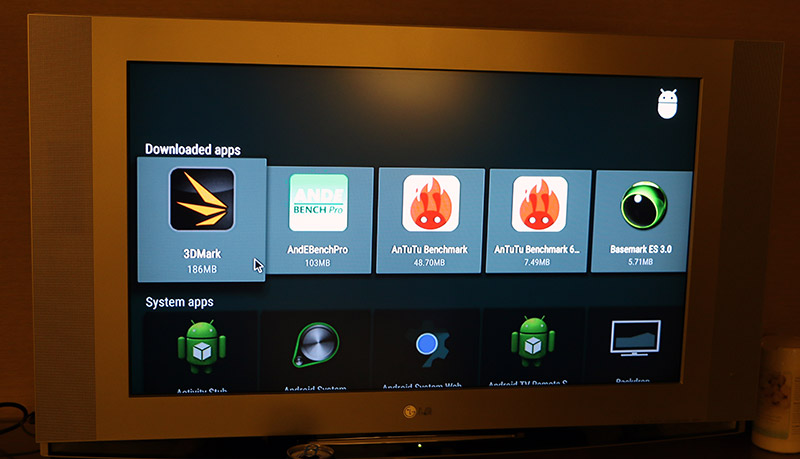
Since we are in San Francisco without any significant comparison devices with us other than our tablet we’ll just let you know what we ran and compare what we can.
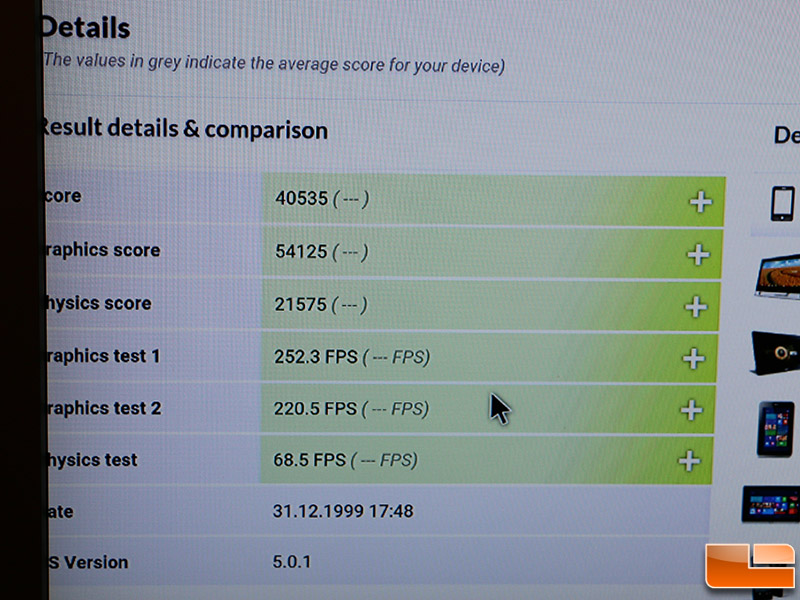
The first benchmark that we ran was 3DMark Ice Storm Unlimited and we found that the new NVIDIA SHIELD with the Tegra X1 SoC was around 30% faster than the NVIDIA SHIELD Tablet with the Tegra K1 SoC.
- Overall Score
- SHIELD (Tegra X1): 40,535
- SHIELD Tablet (Tegra K1): 31,405
- Graphics Score
- SHIELD (Tegra X1): 54,125
- SHIELD Tablet (Tegra K1): 37,168
- Physics Score
- SHIELD (Tegra X1): 21,575
- SHIELD Tablet (Tegra K1): 20,357
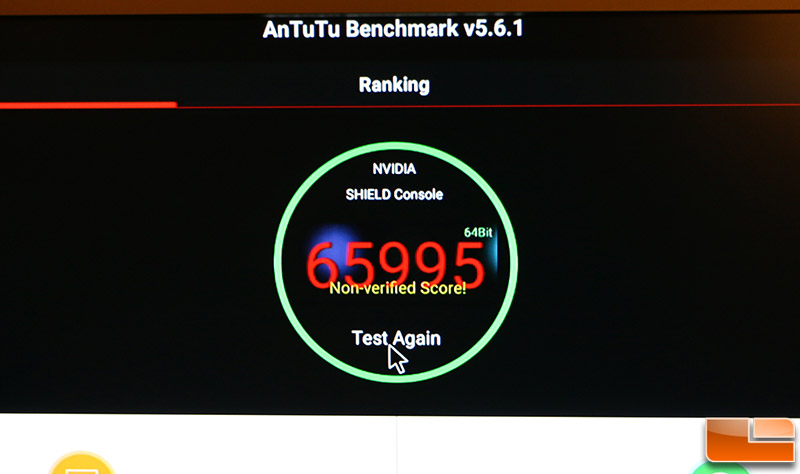
AnTuTu Benchmark v5.6.1 on the NVIDIA SHIELD Console gave us a score of 65,995. This is a 15.6% improvement over the Tegra K1 SoC in the SHIELD Tablet on a benchmark that has a fairly light GPU workload.
- SHIELD (Tegra X1): 65,995
- SHIELD Tablet (Tegra K1): 57,047
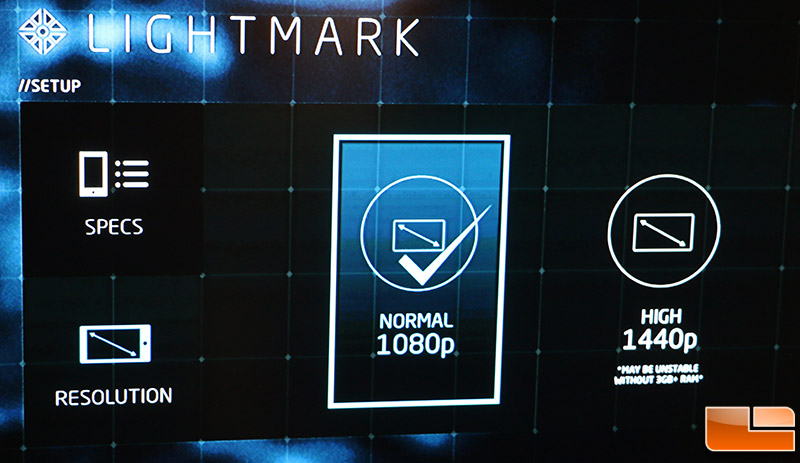
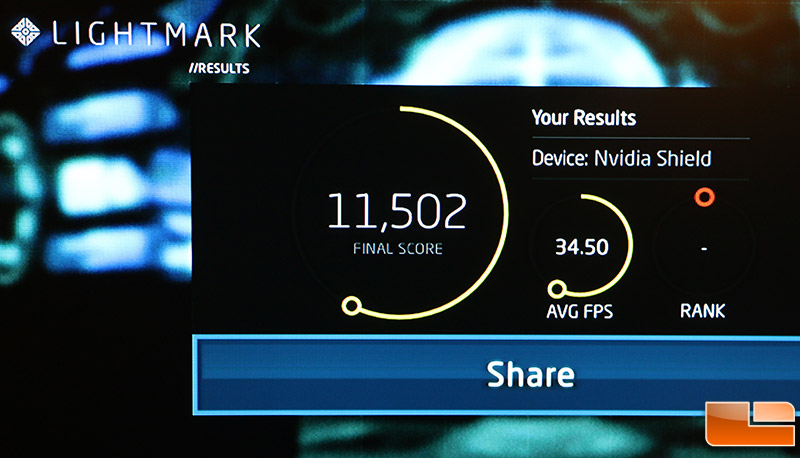
Next up we have the Lightmark benchmark results where we tested with normal 1080p settings and got a final score of 11,502 and an average FPS of 34.50 during the benchmark run. This average FPS is an impressive 49% faster than that of the NVIDIA SHIELD Tablet!
- Overall Score
- SHIELD (Tegra X1): 11,502
- SHIELD Tablet (Tegra K1):7,689
- Average FPS
- SHIELD (Tegra X1): 34.50
- SHIELD Tablet (Tegra K1): 23.06
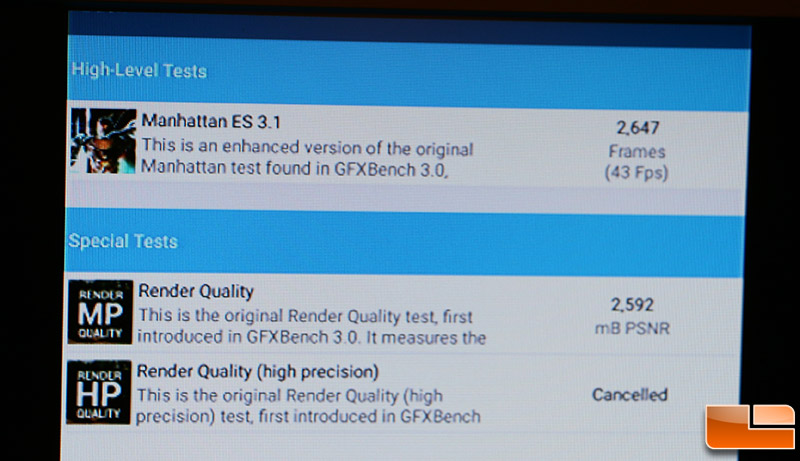
The next test we ran was GFXBench 3.1, an OpenGL ES 3.1-based, cross-platform and cross-API 3D graphics benchmark that measures graphics performance, long-term performance stability, render quality and power consumption in a fairly simple application. GFXBench 3.1 includes a special test Manhattan which is an intensive benchmark for the latest high-end mobile devices that utilize OpenGL ES 3 and ES 3.1. It features enhanced low-level tests, that exercise Compute shaders, Indirect draw-calls, HDR, and enhanced Depth-of-Field. You can download this benchmark for free on Google Play.
- Manhattan ES 3.1 Onscreen
- SHIELD (Tegra X1): 2,647 (43 FPS)
- SHIELD Tablet (Tegra K1): 1,345 (22 FPS)
- Render Quality
- SHIELD (Tegra X1): 2,592
- SHIELD Tablet (Tegra K1): 4,467
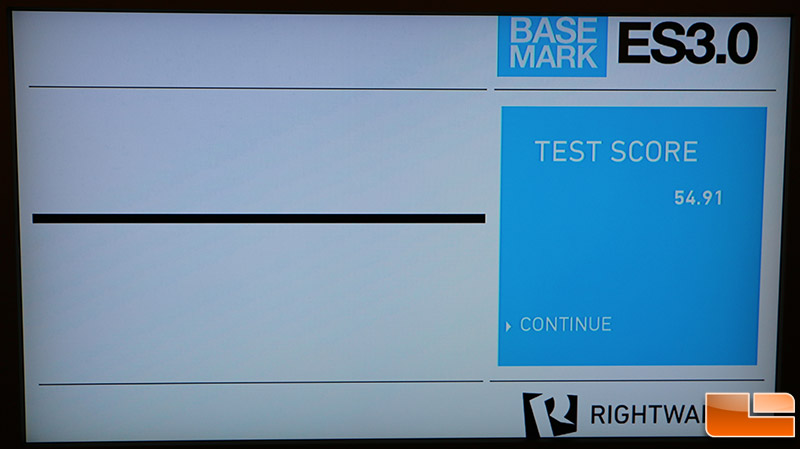
Next up we ran Basemark ES3.0 and ran the DUEL test with the default settings. Our score on the NVIDIA SHIELD set-top box ended up being 54.91.
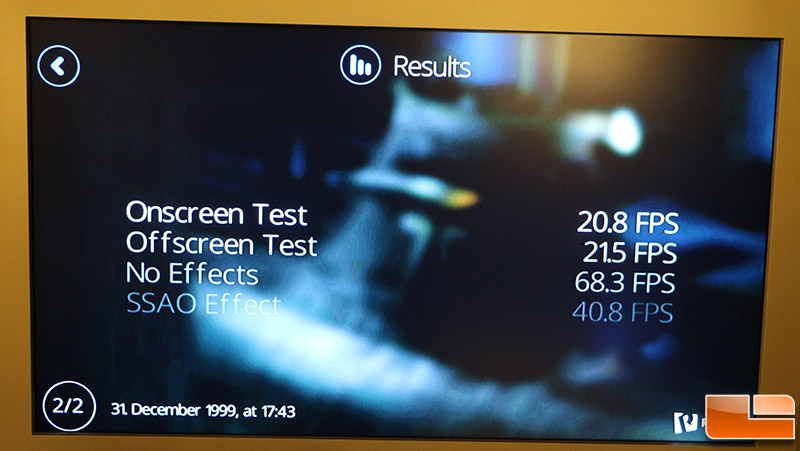
We then ran the brand new Basemark ES 3.1 U-Board benchmark at 1080p with default settings and got a score of 20.8 FPS for the onscreen test and 21.5 FPS on the offscreen benchmark run. If you disabled all the effects the average FPS was found to be 68.3 FPS.
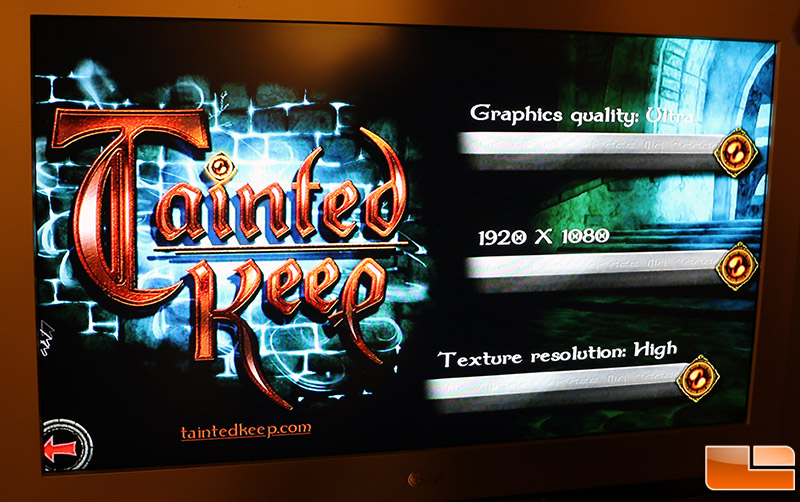
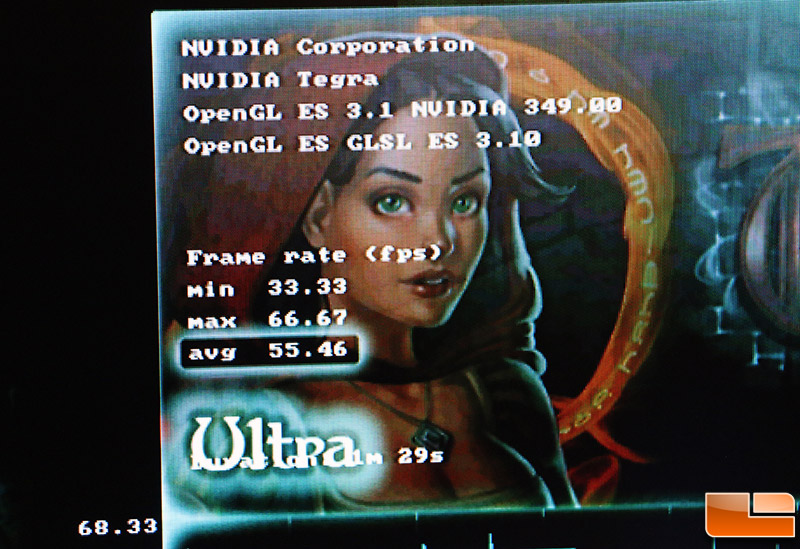
The next benchmark that we ran was the built-in benchmark test in the Action RPG Tainted Keep. Testing was done at 1920×1080 with the graphics quality set to Ultra and the Texture Resolution set to high. The average frame rate with the image quality maxed out was 55.46FPS. The minimum only dropped down to 33.33FPS and the high topped out at 66.67 FPS.
Our time benchmarking the NVIDIA SHIELD console was limited and done in a hotel room on pre-production hardware. The SHIELD Android TV interface was simple to navigate and we were impressed by the performance numbers that we were seeing on the set-top box. Many of our readers will be interested in the gaming performance of the SHIELD console and we have a feeling that most will be impressed by the numbers shown in our quick benchmarking session. Many are wondering if the NVIDIA SHIELD is worth the $199 price tag and we’ll be able to answer that in May when we get the final production hardware and software to try out. We didn’t get to try out the NVIDIA GRID game streaming during our alone time with the box and can’t wait to try it out!
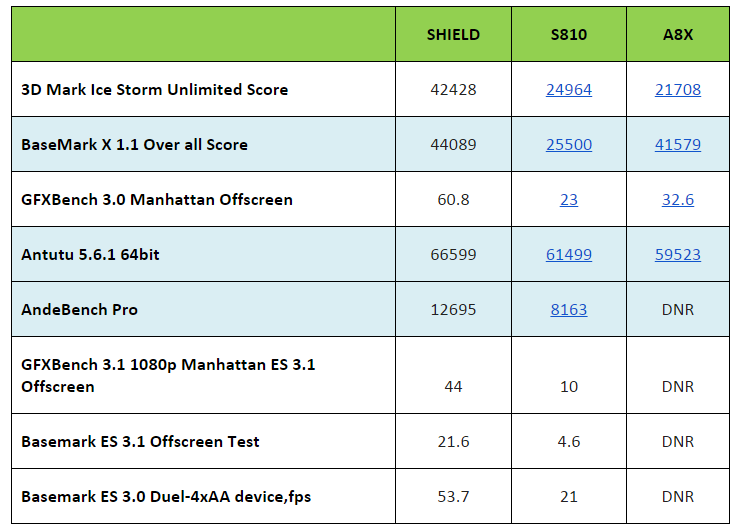
Update 3/6/2015: After we left NVIDIA ran the tests again and then compiled some comparison data of other devices from results they found online and shared them with us. You can see those results in the chart below. The comparison numbers are from Toms Hardware. The S810 benchmark numbers are from a Qualcomm Snapdragon 810 processor in a Mobile Development Platform (MDP) and then the Apple A8X numbers are from an iPad Air 2. The NVIDIA SHIELD Console appears to dominate!