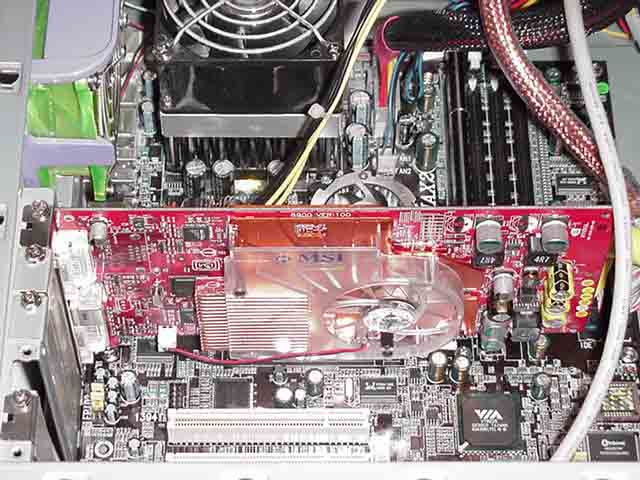
MSI Ti4600-VT2D8X
Benchmarks & Performance:
Our Test System:
- AMD Athlon XP 1600+ (AGOIA stepping)
- ABIT AT7-MAX2 (Enhanced settings enabled in BIOS)
- Alpha PAL 8045 w/80cfm Delta (Air Cooled)
- 256mb Corsair XMS 3500 and 512mb Corsair XMS 3200C2 (2-2-2, 1T, enhanced)
- Western Digital 30Gb ATA 100 7,200rpm
- Soundblaster Audigy X-Gamer
- Antec True Power 430W Power Supply
- ViewSonic E90fb Monitor
Video Cards:
- MSI Ti4600-VT2D8X 128mb (8x AGP)
- MSI Ti4200-TD8X64 64mb (8x AGP)
- Albatron Ti4200P Turbo 128mb (8x AGP)
Testing Procedure:
All testing was done on a fresh install of Windows XP Professional build 2600. All benchmarks were completed on the desktop with no other software programs running. For overclocking the videocards, we used the built-in overclocking feature that is included with the Nvidia 41.09 drivers. We were also using VIA Hyperion version 4.45 4in1 drivers. Our testing processor was running unlocked at 166FSB and a 10.5 multiplyer giving us a grand total of 1.75ghz. During this review, the room temperature was 25 degrees Celsius, while the case temperature was 29 degrees Celsius.
FutureMark; 3dmark2001 Second Edition, Build 330:
3DMark2001SE build 330 is the latest installment in the 3DMark series by FutureMark. By combining DirectX8 support with completely new graphics, it continues to provide good overall system benchmarks. 3DMark2001SE build 330 was created in cooperation with the major 3D accelerator and processor manufacturers to provide a reliable set of diagnostic tools. It demonstrates 3D gaming performance by using real-world gaming technology to test a system’s true performance abilities. All tests were run at 1024×768 at 32 bit color and then again including 4x AA.
The first chart shows the results without AA.
This second chart shows the results using 4x AA.
Results: 3dMark2001SE build 330 shows that the MSI Ti4600-VT2D8X has no problem out performing both the standard speed MSI Ti4200 and the “Turbo” Albatron Ti4200. When all the cards are run at default clock speeds, the MSI Ti4600-VT2D8X has almost 950 more points than the “Turbo” Albatron. Although when set at 4x AA, the Ti4600 is only able to pull 471 points above the others. For the rest of this review, we will be using the Albatron Ti4200P Turbo as the competition.
Nvidia; Chameleon Mark:
Chameleon Mark is not a brand new benchmarking utility, but it still shows a video card’s true capabilities. This benchmark is based upon the popular “Chameleon” demo released by Nvidia with the introduction of the GeForce3 line of GPUs. Chameleon Mark is primarily used to measure pixel shader performance for a variety of shaders.
The first graph is with the two test cards at their default settings.
The next graph looks at the performance increase when overclocked.
Results: Again the Ti4600 is able to pull ahead very nicely.
NovaLogic; Comanche 4:
The Comanche 4 benchmark demo is a unique benchmark as it represents a real-world gaming experience. It contains the single player Eagle’s Talon mission from the game as well as a detailed cinematic. This DirectX 8.1 benchmark demo measures your system’s performance in the standard frames per second format. On this benchmark, we tested our cards at 1024×768 x 32-bit and the audio turned off.
The first graph is with the two test cards without AA.
The next graph shows our results using 4x AA to put even more strain on the cards.
Results: Although the graphs show a big difference, only a 3 frames per second difference was observed. Believe it or not you can actually see the difference between the cards when running the benchmarks.
CodeCult; Code Creatures Pro:
The Codecreatures benchmark is written with Microsoft’s DirectX 8.1 API and incorporates the use of Vertex and Pixel Shaders popular on next generation 3D accelerators. The benchmark plays a photo-realistic nature scene and calculates the performance of the graphics adapter by measuring the FPS that it can display at 1024×768, 1280×1024 and 1600×1200 resolutions. The score is a geometric mean of those three resolutions called the Codecreatures number. For this review, we tested our cards with the sound disabled. We also changed our memory to a 512mb stick of Corsair PC-3200C2 since 512mb of memory is needed for this benchmark.
The first graph is with our two test cards without AA.
Results: I really love this benchmark because it tends to push the cards harder than any other benchmark I use. I also feel that this benchmark is one of the future, since pixel shading and graphics seem to be going in this direction. Pretty numbers on this benchmark, as the MSI Ti4600-VT2D8X pulls out in front again.
That concludes our benchmarks we chose to do on the MSI Ti-4600-VT2D8X video card. Let’s go on and see our final thoughts on the card.
Comments are closed.