IPC Battle – AMD Ryzen 9 3900X Vs Intel Core i9-9900K
AMD’s new 3rd Gen Ryzen processors that are built on the 7nm manufacturing process helped close the performance gap with Intel when they launched last month. Our testing showed that AMD led many of the heavily threaded tests since they had more cores, but Intel was still the single-threaded performance leader. AMD claimed its new 3rd Gen Ryzen CPUs had a 25% increase in IPC (Instructions Per Cycle) and that got us thinking. It has been a long time since we’ve taken two processors with the same number of cores and clock speeds for some proper IPC testing here on the site. The AMD Ryzen 9 3900X and Intel Core i9-9900K are still on the test bench, so we figured why not?
Setting up our IPC test was slightly complicated as we needed both processors to run at the same clock speed with the same number of cores and threads. To accomplish this we headed into the UEFI of both motherboards and set the multiplier to 40. We then disabled four cores on the AMD Ryzen 9 3900X to bring the core count down from 12 to 8. Intel Hyper-Threading and AMD Simultaneous MultiThreading (SMT) was disabled, so we ended up to 8-core, 8-thread processors running locked at 4.0 GHz. Memory was set to 3400MHz with CL16 timings on both systems. We used our standard Z390 and X570 test platforms that you can read more about here with the only difference being both used a Patriot Scorch 256GB NVMe M.2 PCIe Solid State Drive.
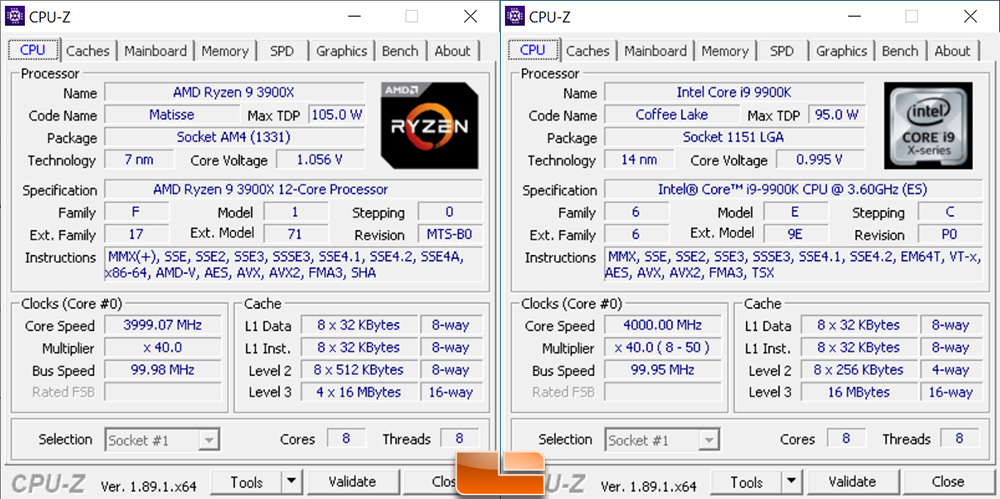
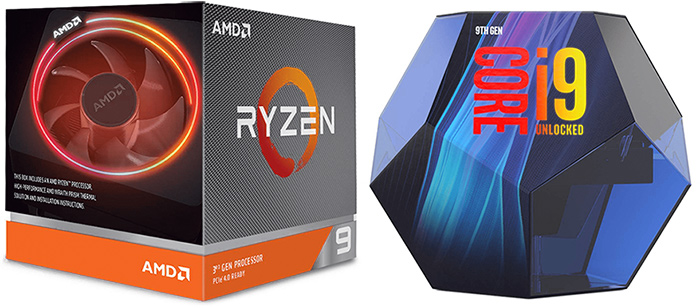
This felt like it put both AMD and Intel on an even playing field as these are the flagship mainstream parts from both companies. One could argue that we could have used the AMD Ryzen 7 3700X to avoid disabling cores, but it only has 32MB of L3 cache whereas the AMD Ryzen 9 3900X has 64 MB of L3 cache. Since we are comparing the flagship models we wanted both AMD and Intel to have their best foot forward. Not to mention the AMD Ryzen 3900X ($499.00) and Intel Core i9-9900K ($479.00) are both price comparable.
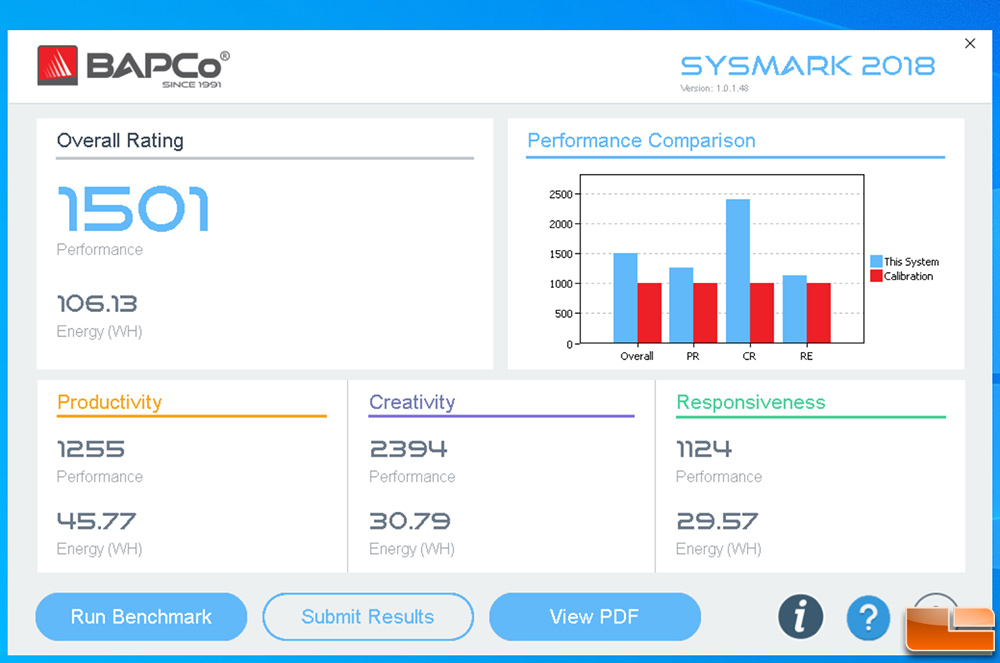
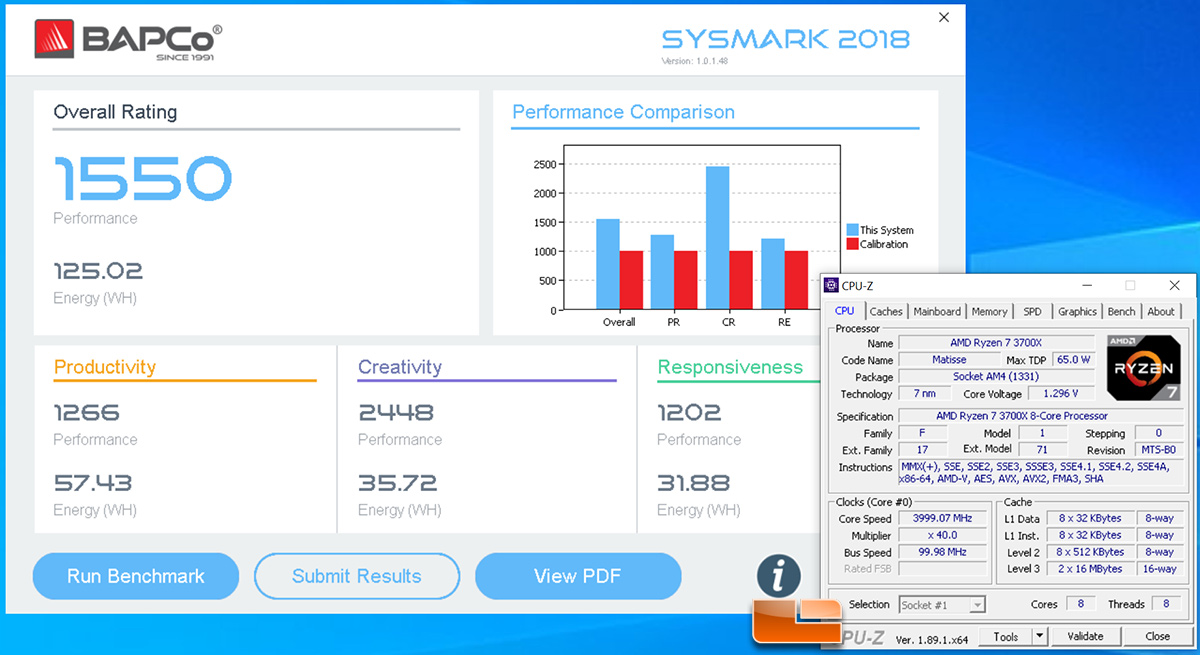
Rather than running our normal benchmark test suite we gave an application-based benchmark called SYSmark 2018 by BAPCo a shot. This benchmark uses unmodified versions of real-world applications for measurement in areas of Productivity, Creativity and Responsiveness. The applications included are Microsoft Office 2016, Google Chrome version 65, Adobe Acrobat Pro DC, Adobe Photoshop CC (2018), Cyberlink PowerDirector 15, Adobe Lightroom Classic CC, AutoIT 3.3.14.2. You can download the SYSmark 2018 white paper here if you’d like to know what exactly it tests and how scoring is handled. We ran the optional conditioning run followed by three iterations of the benchmark to come up with the results below.
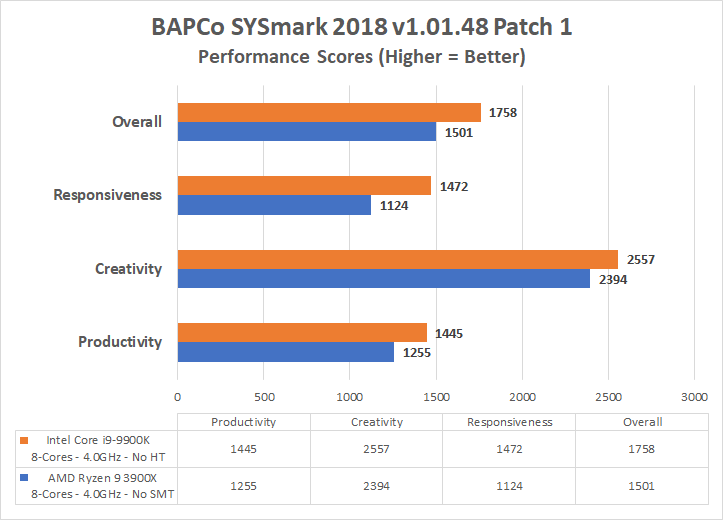
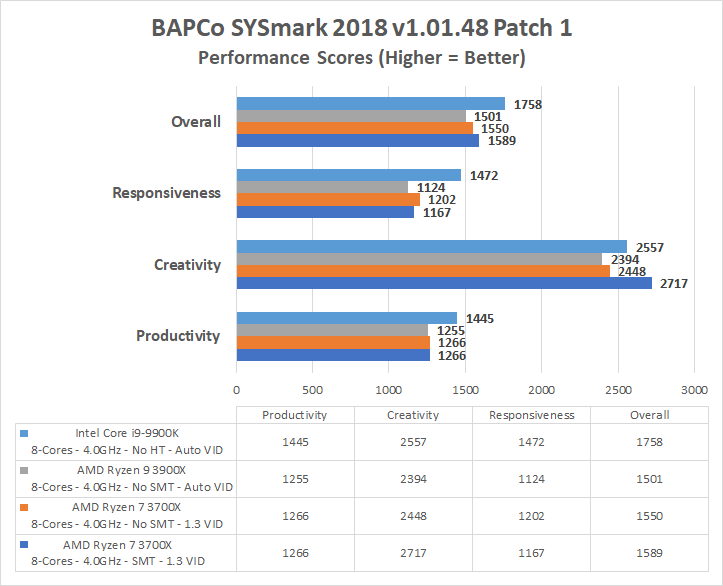
The results from our BAPCo SYSmark 2018 run showed that the Intel Core i9-9900K led all three usage areas. The Intel Core i9-9900K finished with a score of 1,758 while the AMD Ryzen 9 3900X finished with a score of 1,501. This shows that Intel has a 17.1% performance lead over AMD when both of these processors are running at 4GHz on 8-cores.
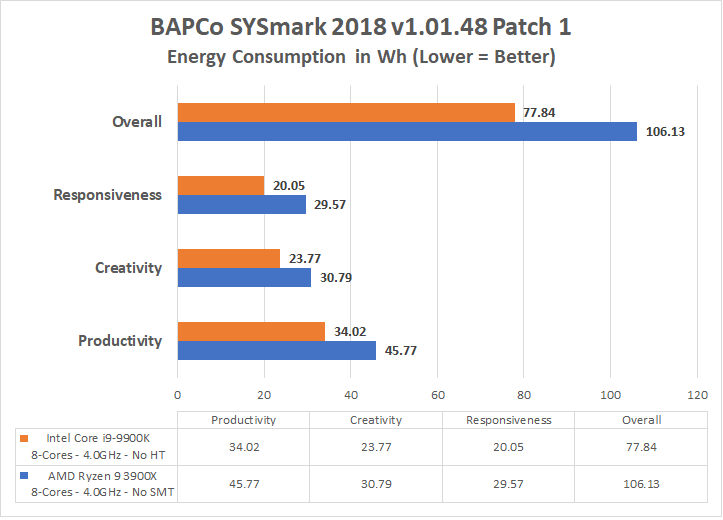
One of the really neat features in BAPCo SYSmark 2018 is that it includes a energy consumption result if you have a supported data logging power meter. We happen to have the proper model, so we were able to measure energy usage in watt-hours during the workloads. The results here show that the Intel Core i9-9900K used 77.84 Wh and the AMD Ryzen 9 3900X used 106.13 Wh while running the workloads. The Intel Core i9-9900K used 28.29 Wh or 26.7% lower system power during a run of SYSmark 2018. This was a bit shocking and paints a very different picture than looking at the maximum power draw of a CPU in a short-term PL2 power state.
So, after tens of hours of setup and testing we discovered that the Intel Core i9-9900K is able to deliver 17.1% more performance than the AMD Ryzen 9 3900X while using 26.7% less system power. That said, this is one benchmark utility and it paints a picture slightly different than some of the other results out there.
Hopefully you enjoyed our little Instructions-Per-Cycle (IPC) experiment. We plan on taking a closer look at SYSmark 2018 shortly. If you’d like to see more experiments like this in the future please leave a comment below!
Update 1: 8/22/2019 2pm – A good number of people ask why BAPCo SYSmark 2018 was used and question if it is a fair benchmark test suite to use. BAPCo claims they do not optimize any applications and have a public statement to that fact: https://bapco.com/faq/
Update 2: 8/22/2019 3pm – It was also crystal clear that the community would have liked to have seen the AMD Ryzen 7 3700X processor used instead of the Ryzen 9 3900X to avoid disabling cores and having a negative impact on performance. This was something that was avoided when we started benchmarking since the 3700X couldn’t run 4.0 GHz on auto Voltage settings. It needed to be manually set at 1.30V (up from 1.20V on auto) on our AMD X570 motherboard. BAPCo SYSmark 2018 was run on the 3700X with the conditioning pass and one iteration enabled in settings with SMT mode both enabled and disabled on the processor. Overall IPC performance did go up by about 3.2% by switching processor models. Enabling SMT gave the Ryzen 3700X another 2.5% performance boost in the overall score and almost an 11% boost in the creativity test suite.