AMD Kaveri Mobile APU Preview – FX-7600P with Radeon R7 Graphics
AMD FX-7600P Kaveri Performance
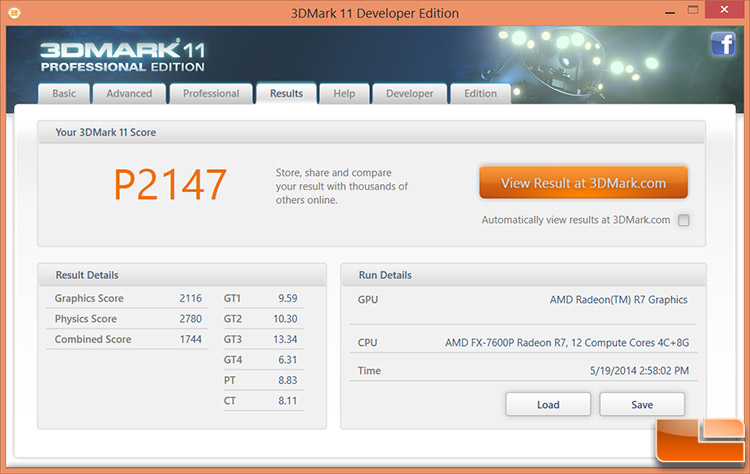
In 3DMark11 we found scores of an overall score of P2147 with the default test preset. The Graphics score was 2116, the physics score was 2780 and the combined score was 1744.
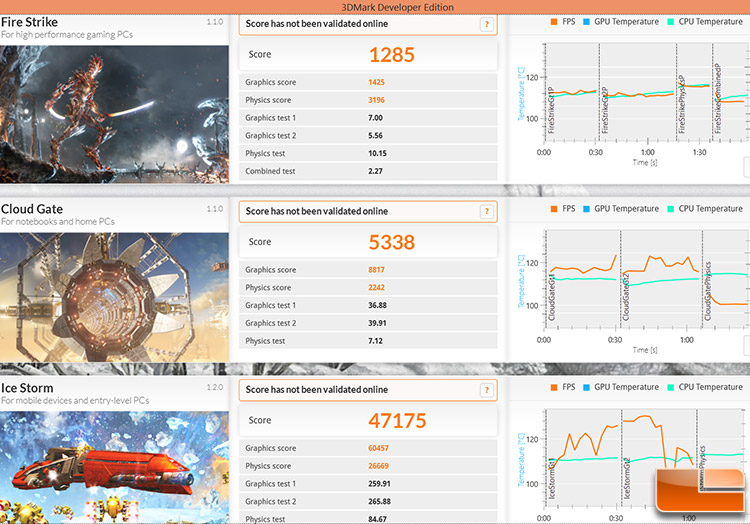
n the latest build of 3DMark we found scores of 1285 in Fire Strike with the AMD FX-7600P with Radeon R7 graphics. This is a pretty damn good score, but slightly slower than the flagship Intel Core i7-4770R processor with Intel Iris Pro Graphics 5200 as it scored 1387 in Fire Strike.
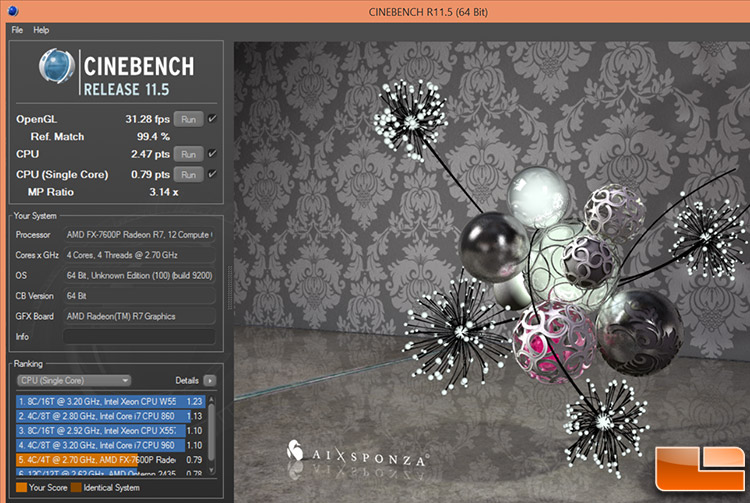
Moving along to Cinebench R11.5 we found the AMD FX-7600P Kaveri APU scored 31.28 FPS on the OpenGL benchmark, 2.47 points on the multi-core CPU test and 0.79 points on the single CPU test.
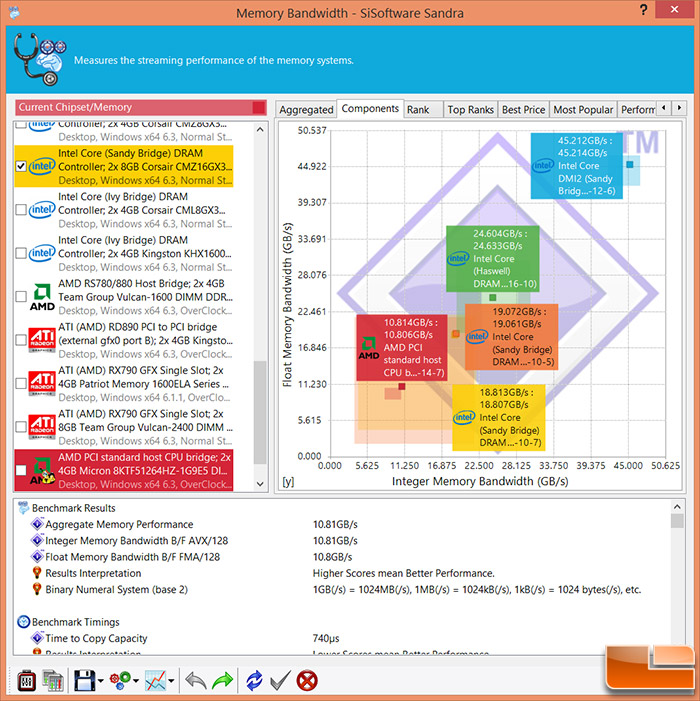
A quick look at the memory performance showed just shy of 11 GB/s of bandwidth. This sounds a little low for a dual channel memory kit running at 18663MHz with CL13 memory timings, but that is what it scored.
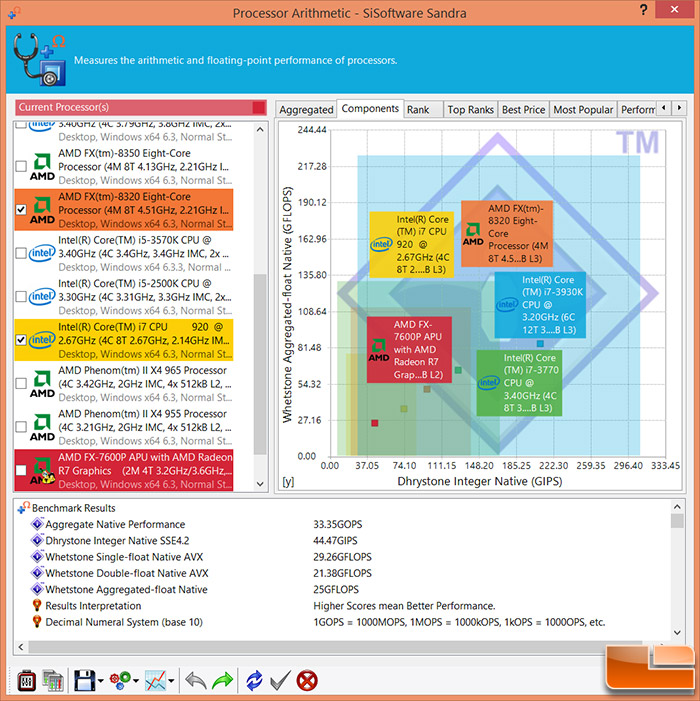
In Sandra Processor Arithmetic the aggregate native performance score was 33.35 GOPS.
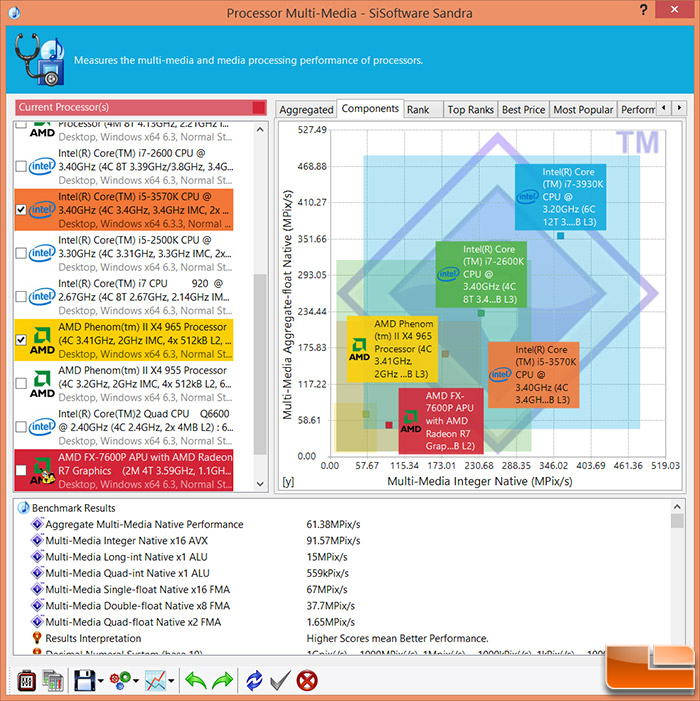
The Sandra Processor Multi-Media aggregate performance score was 61.38 MPix/s.
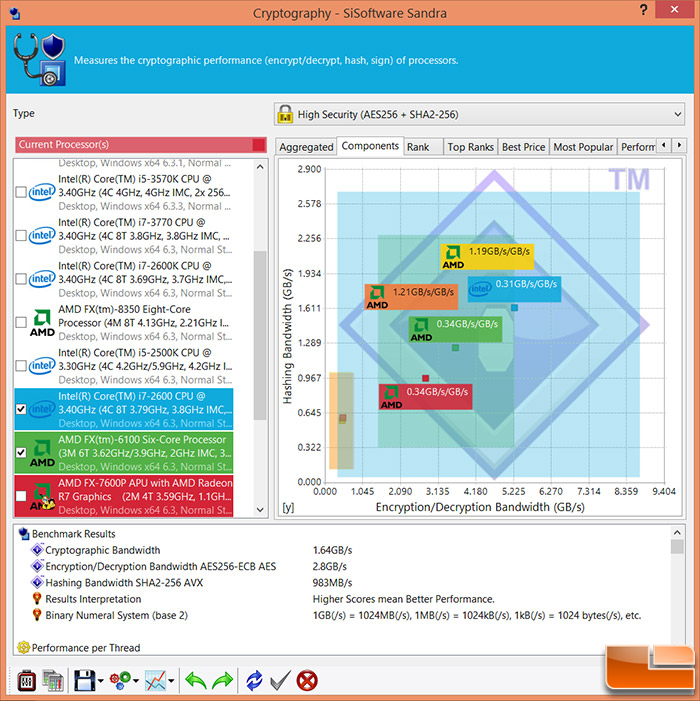
The Sandra Processor Cryptography bandwidth results showed the AMD Kaveri APU powered notebook was capable of 1.64GB/s.
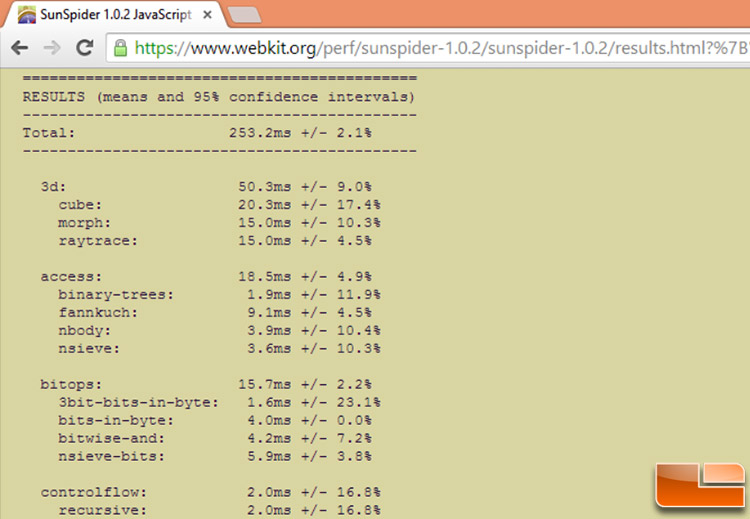
We ran the SunSpider 1.0.2 JavaScript Benchmark on Google Chrome 34 and received a score of 253.3ms. The Intel Bay Trail-M NUC finished at 694.0ms, so you can see a big difference between a low-end and high-end processor when it comes to JavaScript performance.
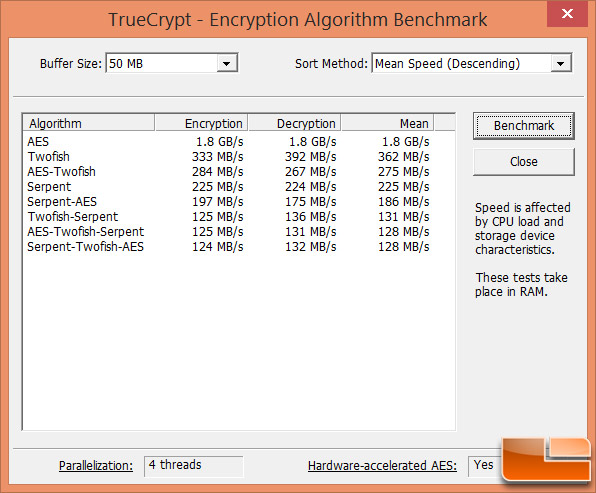
In the Encryption Algorithm Benchmark that comes inside TrueCrypt we found an AES mean score of 1.8 GB/s.
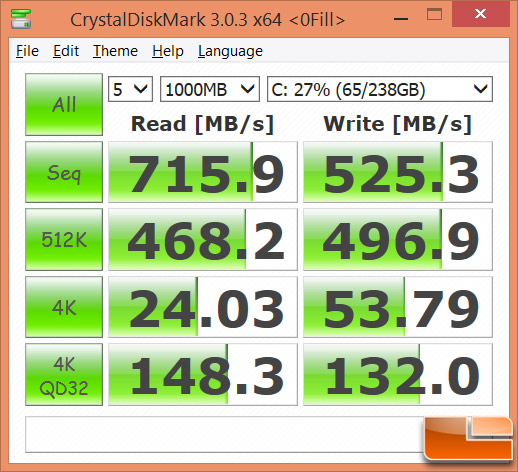
A quick run of CrystalDiskMark v3.0.3 64-bit showed the sequential read speed at 715 MB/s and the write speed at 525.3 MB/s! The Random 4K read speed was 24.03MB/s and the 4K random write speed was 53.79MB/s. Not bad scores from the Samsung XP941 256GB M.2 PCIe SSD.
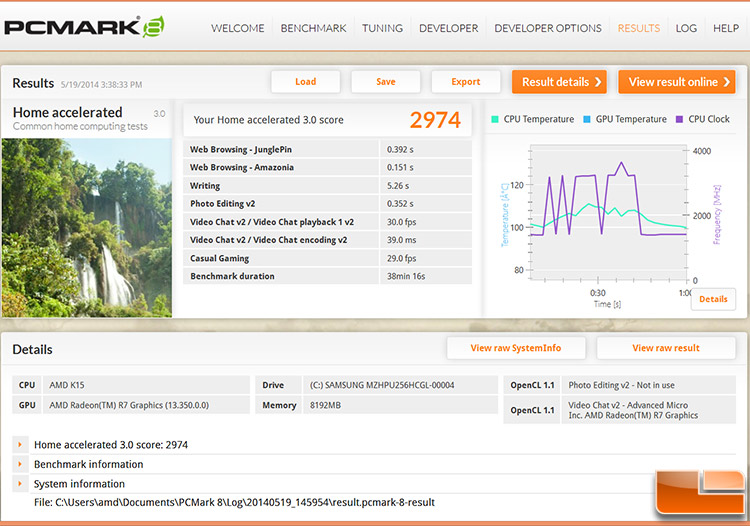
The PCMark 8 Home Accelerated 3.0 benchmark score came in at 2974 with the video playback above 30FPS for the video chat and our casual gaming score was at 29 FPS.
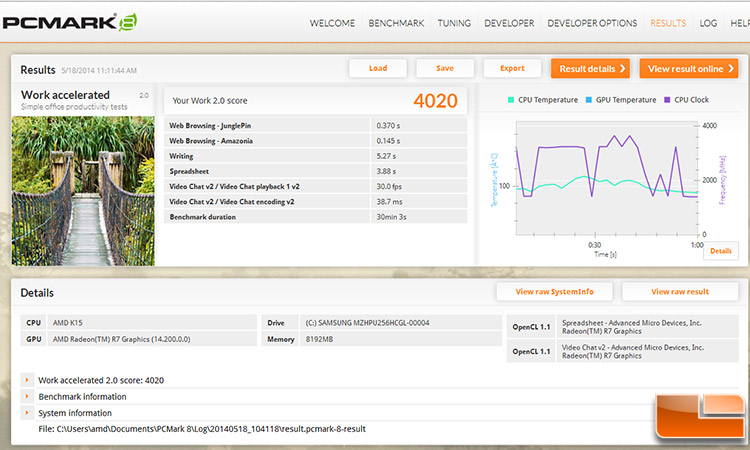
The PCMark 8 Work Accelerated 2.0 benchmark score was 4020 with the video chat playback being 30.0FPS once again.
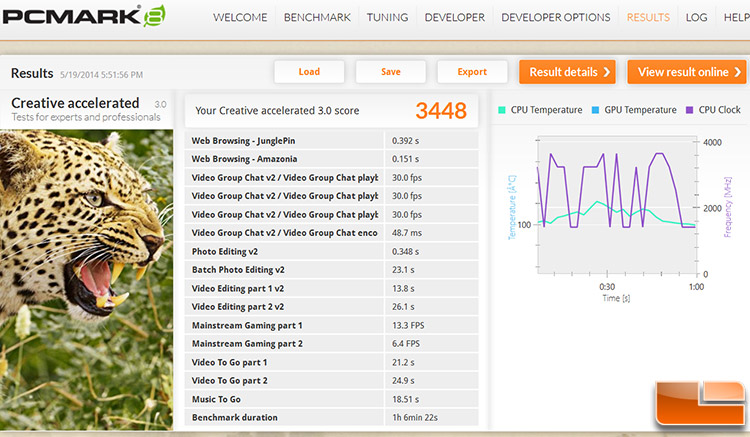
The final PCMark 8 benchmark that we ran was Creative Accelerated where we got an overall score of 3448. The video chat playback score came in for a third time at 30.0 FPS, so all three PCMark 8 tests that we ran had identical results there. The gaming test on this benchmark was much tougher as the gaming part one test had us at 13.3 FPS and part 2 was at 6.4 FPS.
Let’s take a look at some game performance results: