AMD A10-5800K Trinity Desktop APU Review
Cinebench R11.5
MAXON; CINEBENCH R11.5:
MAXON recently released CINEBENCH Release 11.5, an advanced hardware
testing suite that assesses a computer’s performance capabilities.
CINEBENCH is based on the same powerful technology as MAXON’s
award-winning animation software CINEMA 4D, which is used extensively by
studios and production houses worldwide for 3D content creation. The
new version of CINEBENCH includes the ability to more accurately test
the industrys latest hardware, including systems with up to 64
processor threads, and the testing environment better reflects the
expectations of todays production demands. A more streamlined interface
makes testing systems and reading results incredibly straightforward.
Again, higher Frames/Second and point score equal better performance.
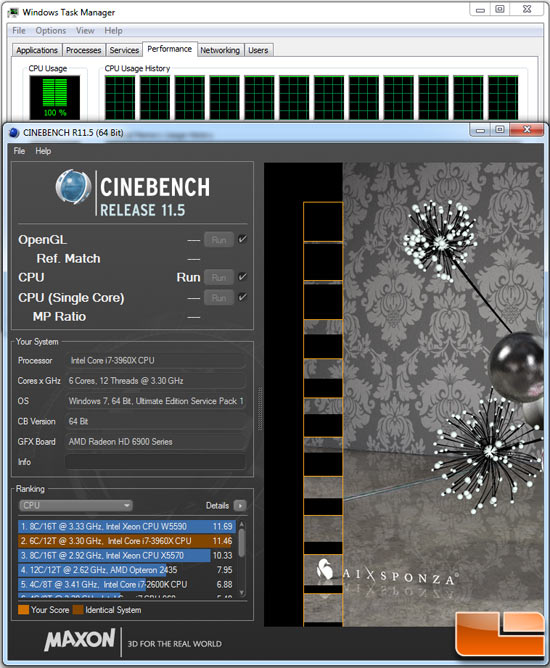
Cinebench R11.5 was able to put a 100% load across all the cores on
all of the processors, which makes this a great benchmark to look at
multi-core platforms.
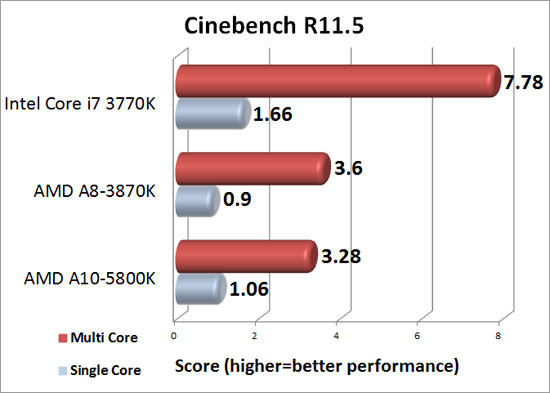
Benchmark Results: Cinebench R11.5 gives us some intriguing results. The single core performance of the AMD A10-5800K gave us a score of 1.06 while the single core performance of the A8-3870K had a score of .9. We would think that this would translate to similar results in the SMP benchmark in Cinebench. To our disappointment it didn’t. The AMD A8-3870K was able to score 3.6, while the AMD A10-5800K was slower with a score of 3.28.
Comments are closed.