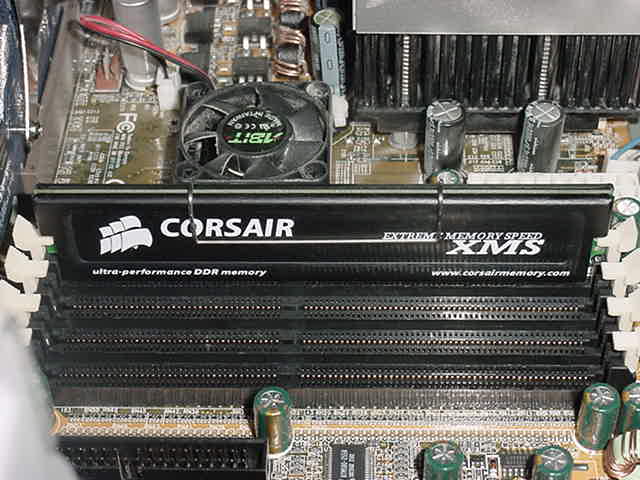
512mb Corsair PC3200C2
Benchmarks & Performance:
Our Test System:
- AMD Athlon XP 1600+ (AGOIA stepping)
- Abit KX7-333R (Enhanced settings enabled in BIOS)
- Alpha PAL 8045 w/80cfm Delta (Air Cooled)
- Abit OTES Ti-4200 64mb (Default)
- 512mb Corsair XMS PC-3200C2
- Western Digital 30Gb ATA 100 7,200rpm
- Soundblaster Audigy X-Gamer
- Antec True Power 430W Power Supply
- ViewSonic E90fb Monitor
Testing Procedure:
All testing was done on a fresh install of Windows XP Professional build 2600. The tests were done on the desktop with no other software programs running. No overclocking was done on the ABIT OTES video card. We ran the Athlon 1600+ at 166FSB, giving us 1,754mhz during all tests. The tests were run in this order; 3dmark, Sisoft and lastly PCmark. Once all the tests were completed we restarted and changed the BIOS settings. During this review the room temperature was 24degrees Celsius, while the case temperature was 29 degrees Celsius.
3dmark2001 SE 330:
3DMark2001SE build 330 is the latest installment in the 3DMark series by MadOnion. By combining DirectX8 support with completely new graphics, it continues to provide good overall system benchmarks. 3DMark2001SE build 330 was created in cooperation with the major 3D accelerator and processor manufacturers to provide a reliable set of diagnostic tools. It demonstrates 3D gaming performance by using real-world gaming technology to test a system’s true performance abilities. We used this to show how the Corsair performed on different timings.
Results: 3DMark2001SE build 330 shows the benefit of using agressive ram timings. As you can see, we enjoyed an almost 500 point gain in 3dmark just by changing the ram settings in our bios. Also you can tell 3dmark likes the extra speed these settings deliver. Not bad here!
PCMark:
PCMark is another benchmark from MadOnion which is a whole system benchmark, although we are only going to look at the memore results. PCMark specifically stresses the CPU, memory subsystem, graphics subsystem, hard drives, WindowsXP GUI (if WinXP is used), video performance and even laptop batteries. This benchmark was released March 12, 2002 and can be downloaded from Madonion if you would like to give it a test run on your computer to see how you do compared to our results.
Results: Once again our most agressive settings come in on top, PCMark 2002 give us a great picture of the boost each setting has to offer. Even though I didn’t graph it our CPU scores were 5251, 5277, 5299, 5322. These again go perfectly with the data graphed above.
Sisoft Sandra 2002 Pro SP1:
Sandra is designed to test the theoretical power of a complete system and individual components. The numbers taken though are again, purely theoretical and may not represent real world performance. Higher numbers represent better performance.
Results: Weird data here! I even ran the tests two or three times per setting, but the figures were all close to the same. Since this test is based more on theoretical beliefs, I personally like the above benchmarks better, but I wanted you to see the hours of work that went into the above benchmarking.
Now that I have seen the results let me sum up my overall impression of our stick of Corsair PC-3200C2!
Comments are closed.