Kingston HyperX T1 2800MHz DDR3 Memory Review on Ivy Bridge
Sandra, H264 HD and 3DMark11 Benchmarks
DDR3 Memory Speed Performance From 1066MHz to 2800Mhz
We often get asked about how memory clock speeds and timings impact system performance, so we took the HyperX T1 2800MHz memory kit and ran it at seven different clock speeds on the same system. On this page you’ll see results of HyperX T1 4GB (2x2GB) dual channel memory kit at 1066, 1600, 1866, 2133, 2400, 2666 and 2800 MHz.
SiSoftware Sandra 2012 SP4:
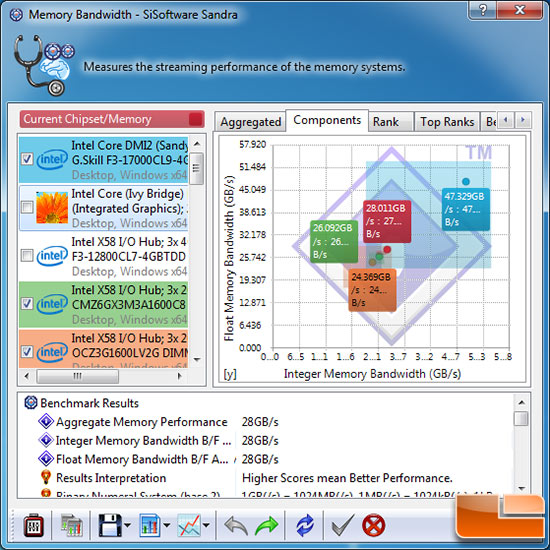
The Sisoft Sandra 2012 SP4 benchmark utility just came out and we have started to include it in our benchmarking.
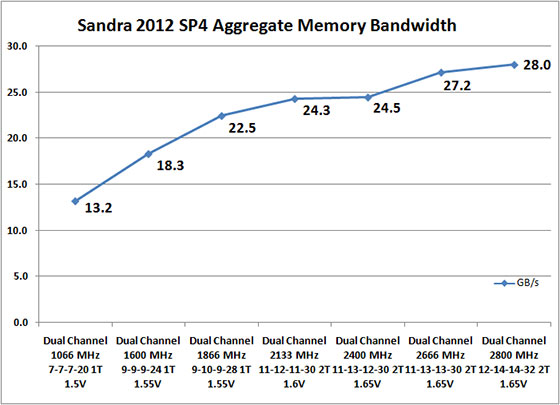
Results: Sandra
2012 does a great job at showing how the memory bandwidth scales from 13.2 GB/s at 1066MHz all the way up to 28.0 GB/s at 2800MHz. We set the memory timings what we consider common settings at 1066 to 1866MHz and then set the kit to what Kingston will be offering at 2133MHz to 2800MHz. The performance scaled pretty nicely, but we were unable to find a reason why the performance gain from 2133MHz to 2400MHz wasn’t significant. We cleared the CMOS of the motherboard and double checked out numbers, but the results remained the same.
x264 HD Encoding

Simply put, the x264 HD Benchmark is a reproducible measure of how
fast your machine can encode a short HD-quality video clip into a high
quality x264 video
file. It’s nice because everyone running it will use the same video clip
and software. The video encoder (x264.exe) reports a fairly accurate
internal benchmark (in frames per second) for each pass of the video
encode and it also uses multi-core processors very efficiently. All
these factors make this an ideal benchmark to compare different
processors and systems to each other. We are using x264 HD v4.0 for this test.

Results: The
memory clock speed plays a small roll in performance here on x264 HD,
but you can see some interesting things going on here. For starters from 1066Mhz to 1866Mhz you see significant performance gains on the first pass as the memory clock speed increases. When you make the jump up from 1866 CL9 memory to 2133MHz CL11 memory you get a performance hit due to the the looser timings. After that you see performance start to pick up again, but it must not be needed as performance doesn’t scale like it did on the lower end of the chart.
3DMark 11

3DMark 11 is the latest version of the worlds most popular benchmark for measuring the 3D graphics performance of gaming PCs. 3DMark 11 uses a native DirectX 11 engine designed to make extensive use of all the new features in DirectX 11, including tessellation, compute shaders and multi-threading.

We ran Futuremark 3DMark11 with the default performance presets to see how our hardware will run.

Results: The
overall 3DMark score ranged from 780 to 810 3DMarks, which is pretty modest. For testing we used the Intel Core i7-3770K processor and did not use a discrete graphics card, so the test results above are with Intel HD Graphics 4000. The Physics test
did showed some decent performance increases though as it takes advantage of the additional memory bandwidth. We see the performance drop from 1866MHz at 9-10-9-28 1T to 2133MHz at 11-12-11-30 2T again, but after that performance continues to go up again as the memory bandwidth increases. The Kingston HyperX T1 2800MHz memory kit had the highest overall score and physics score in 3DMark11.
Comments are closed.