Angelbird SSD wrk 256GB SSD Review – Silicon Motion SM2246EN
PCMark 8 Consistency Test
Something new we are starting to do is run the storage consistency test in the PCMark 8 application from Futuremark. In short, it looks at drive performance degradation as the drive becomes “dirty” and how it rebounds after given time to recover and run background routines like garbage collection and TRIM. This takes nearly a day to run through all of the iterations of test sets. Since most of our benchmarks show the drive performance in a clean state, this is a nice contrast to provide yet another view of performance. PCMark 8’s storage benchmark test contains workload traces from Adobe Photoshop, Adobe Illustrator, Adobe InDesign, Adobe After Effects, Microsoft Word, Microsoft Excel, Microsoft Power Point, World of Warcraft and Battlefield 3.
The PCMark 8 Consistency test has five phases:
Precondition phase
- Write the drive sequentially through up to the reported capacity with random data.
- Write it through a second time (to take care of overprovisioning).
Degradation phase
- Run writes of random size between 8*512 and 2048*512 bytes on random offsets for 10 minutes.
- Run performance test (one pass only). The result is stored in secondary results with name prefix degrade_result_X where X is a counter.
- Repeat 1 and 2 for 8 times and on each pass increase the duration of random writes by 5 minutes
Steady state phase
- Run writes of random size between 8*512 and 2048*512 bytes on random offsets for final duration achieved in degradation phase.
- Run performance test (one pass only). The result is stored in secondary results with name prefix steady_result_X where X is a counter.
- Repeat 1 and 2 for 5 times.
Recovery phase
- Idle for 5 minutes.
- Run performance test (one pass only). The result is stored in secondary result with name recovery_result_X where X is a counter.
- Repeat 1 and 2 for 5 times.
Clean up
- Write the drive sequentially through up to the reported capacity with zero data.
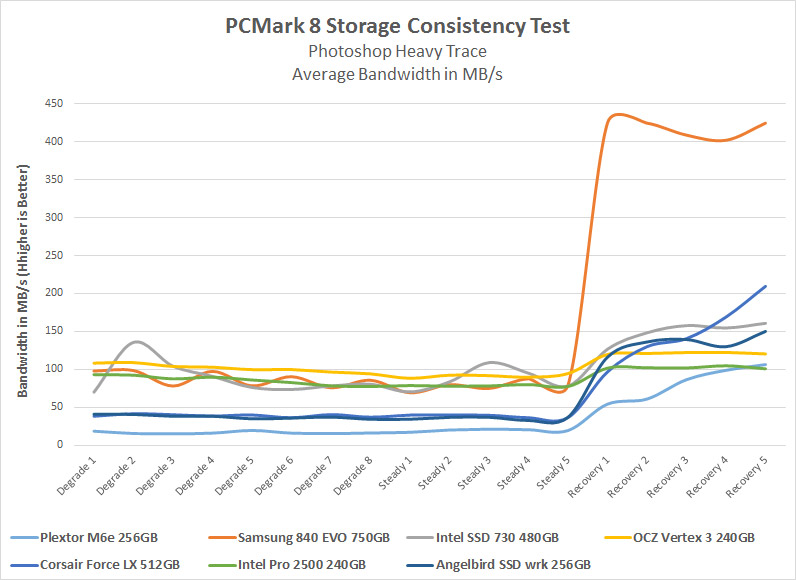
Benchmark Results: There is a pretty significant difference between rives when it comes to performance in a optimized TRIM state versus a heavily used state without the time needed to execute the TRIM command. The chart above looks at the Photoshop Heavy Trace test scenario. The Angelbird SSD wrk 256GB drive averaged around 40MB/s in the worst-case dirty/degraded states, but that increased up to about 140MB/s when given time to recover. The Angelbird SSD wrk 256GB drive wasn’t the fastest drive in the group, but performed nicely for a budget drive.
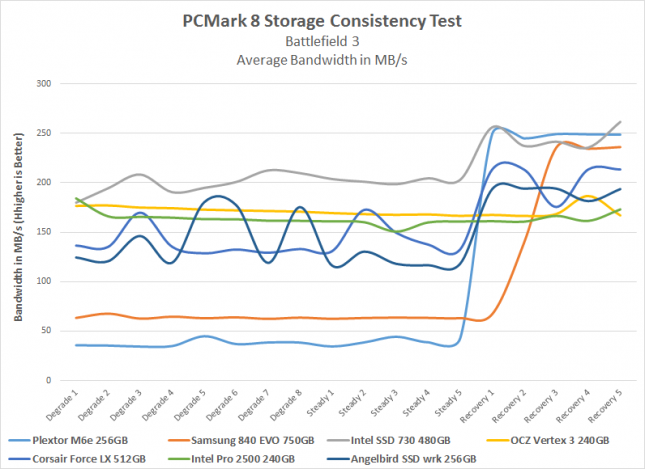
Benchmark Results: Gaming performance might not be the best test case for a budget-class SSD, but we see that the Angelbird SSD wrk 256GB drive does pretty good and averaged about 130MB/s in the degrade tests with a few spikes here and there. When recovered the performance jumped up to nearly 200MB/s. t even white collar professions game.
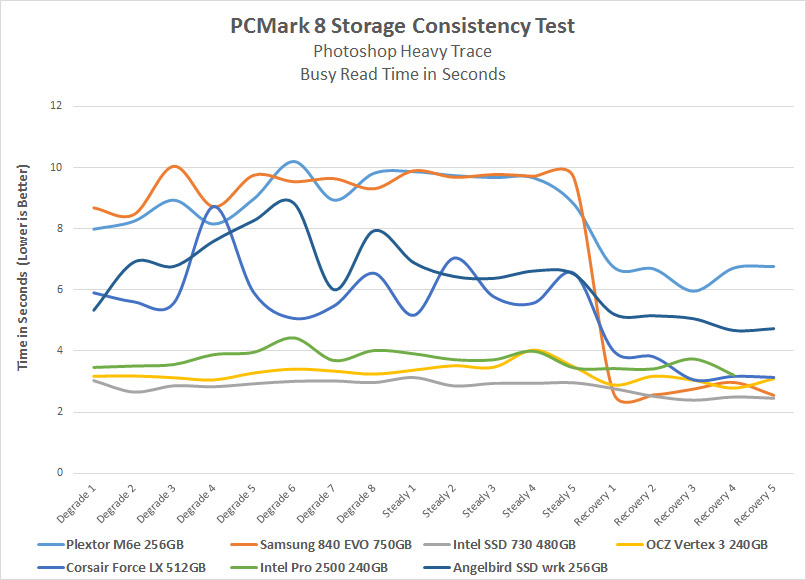
Benchmark Results: This chart looks at the total busy time that the drives are doing the read test in the Photoshop Heavy Trace workload. The lower the time the better and you can see the Angelbird SSD wrk 256GB drive is in the middle of the pack.
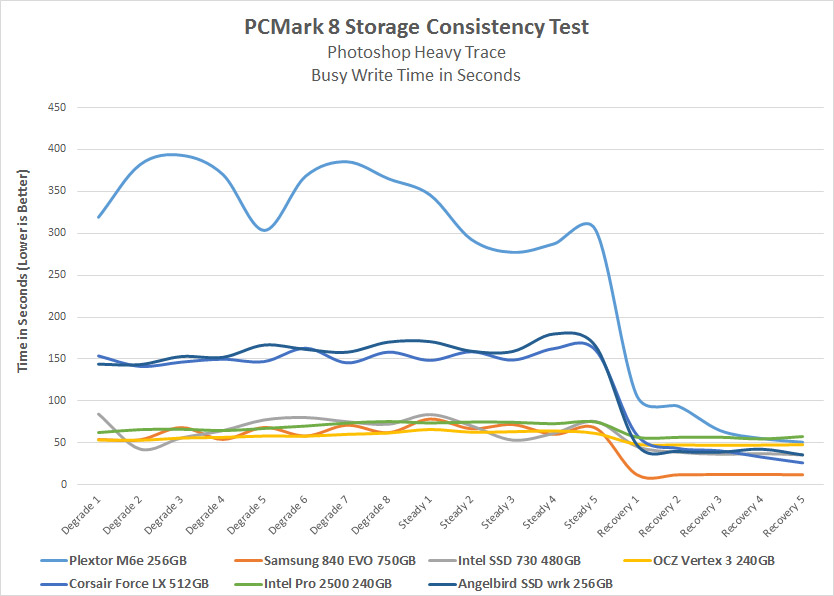
Benchmark Results: This chart looks at the total busy time that the drives are doing the write test in the Photoshop Heavy Trace workload. The Angelbird SSD wrk performed decently when it comes to write times and the performance was close to other SM2246EN controllers that we have tested before (Corsair Force LX 512GB).