PaLiT Revolution 700 HD 4870 X2 Video Card Review
3DMark Vantage Results
Given that the performance from this HD 4870 X2 won’t be much different than Nathan’s review of PaLiT’s reference HD 4870 X2, I have decided to focus less on the actual performance and more on the performance scaling. If you are interested in actual game performance results of an HD 4870 X2 I implore that you check out Nathan’s HD 4870 X2 review.
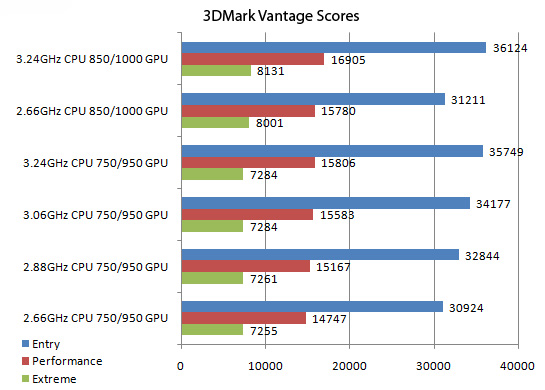
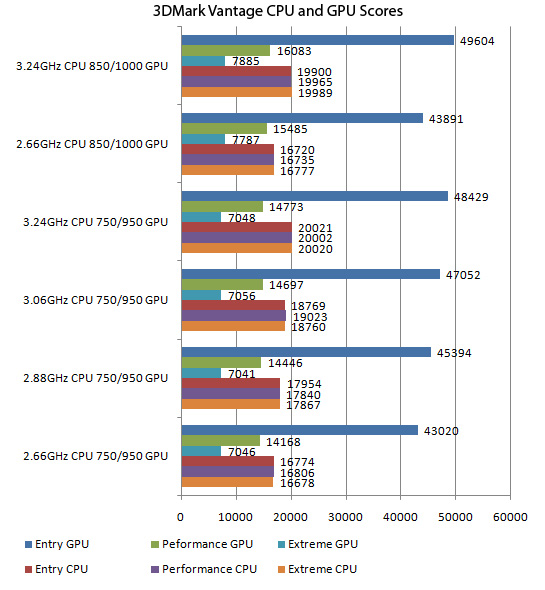
It is a little known fact that as resolution grows, the CPU stops being the bottleneck as the GPU starts to get overwhelmed with details. To show precisely how powerful this card is and how much of a bottleneck the CPU can be at various resolutions I performed a ton of testing using 3DMark Vantage. I know well enough that 3DMarks don’t equate to gaming performance but we already know how well the HD 4870 X2 excels at gaming. Below the graphs tell a story of massive performance scaling with both CPU overclocks and GPU overclocks.


There are a few trends to take notice of with the above charts. First, at the Entry preset (1024×768), the HD 4870 X2 scaled better with CPU clocks than GPU clocks with the max GPU OC only netting a 43.8k GPU score, and the max CPU OC netting a 48.4k GPU score. Running both the GPU and CPU OC raised it to 49.6k, showing how little the GPU overclock mattered at 1024×768.
Moving to the Performance (1280×1024) preset, the CPU starts to take a backseat to the GPU in regards to performance. The max GPU OC yielded a 15.4k GPU score while the CPU OC yielded 14.7k. Combining the two yielded a modest 16k GPU score, which is still a decent improvement showing that at 1280×1024 it’s a combination of CPU and GPU power.
Moving to the Extreme (1920×1200) preset, the CPU becomes irrelevant with the GPU becoming a solid bottleneck to performance. The max GPU OC yielded a huge 7.7k while the max CPU OC yielded a paltry 7k, equivalent to running at stock CPU speeds. Combining the CPU and GPU OC improved the score to 7.8k, which is nothing compared to the previous two presets.
Just comparing the resolutions, the jump from Entry to Performance is a 70% jump in pixels. The jump from Performance to Extreme is another 78% pixel jump. I didn’t include the High (1680×1050) preset as it’s an odd jump between 1280×1024 and 1920×1200. Screen resolution isn’t the only thing that changes with the various presets. Texture quality, shadow shaders, post-processing, and multi-sampling all scale with the Entry preset being the base and the Extreme preset having all settings maxed out.

Comments are closed.