Intel and NVIDIA Graphics Shipments Are Up
Intel and Nvidia raised shipments levels for the quarter Quarter-to-quarter total graphics up 1.6%, Desktop graphics sales up 4.5%
TIBURON, CA-November 18, 2013Jon Peddie Research (JPR), the industry’s research and consulting firm for graphics and multimedia, announced estimated graphics chip shipments and suppliers market shares for 2013 3Q.
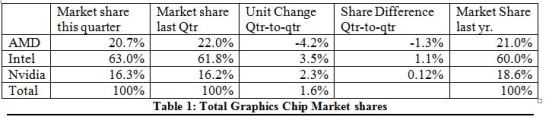
Q313 was the second quarter in a row to show a gain in shipments, up 1.6% quarter-to-quarter, but down 8.8% compared to the same quarter last year.
AMDs overall unit shipments decreased 4.2% quarter-to-quarter, Intels total shipments increased 3.5% from last quarter, and Nvidias increased 2.3%. The attach rate of GPUs to PCs for the quarter was 137%, which means only 73% of the PCs with embedded graphics are using them.
The overall PC market increased 6.8% quarter-to-quarter, but declined 7.6% year-to-year.
Q3 is the quarter when retailers stock up for the holiday season and is traditionally seasonally higher than previous quarters. The gain this quarter compared to pre-2008 years is smaller, but it is positive.
GPUs are traditionally a leading indicator of the market, since a GPU goes into every system before it is shipped and most of the PC vendors are guiding down to flat for Q413.
The popularity of tablets and the persistent economic slowness are the most frequently mentioned reasons for the decline in the PC market. The CAGR for total PC graphics from 2012 to 2016 is -2.7%; we expect the total shipments of graphics chips in 2016 to be 429 million units. In 2012, 479 million GPUs were shipped and the forecast for 2013 is 436 million.
Over a ten-year period the average quarter-to-quarter change showed a 6.5% increase. This quarter is below the average with a 1.6% increase.
Our findings include discrete and integrated graphics (CPU and chipset) for Desktops, Notebooks (and Netbooks), and PC-based commercial (i.e., POS) and industrial/scientific workstations as well as embedded systems. This report does not include handhelds (i.e., mobile phones), x86 Servers or ARM-based Tablets (i.e. iPad and Android-based Tablets), or ARM-based Servers. It does include x86-based tablets, and x86-based Chromebooks.
The quarter in general
AMDs shipments of desktop heterogeneous GPU/CPUs, i.e. APUs, jumped 27.8% from Q2 but declined 21.3% in notebooks. AMDs discrete desktop shipments declined 3.1%, and notebook discrete shipments declined 4.5%. The companys overall PC graphics shipments decreased 4.5%.
Intels desktop processor-graphics EPG shipments decreased from last quarter by 1.1%, and Notebooks increased by 5.1%. The companys overall PC graphics shipments increased 3.5%.
Nvidias desktop discrete shipments showed the most growth, up 8.2% from last quarter; however, the companys notebook discrete shipments decreased 3.3%. The companys overall PC graphics shipments increased 2.3%.
Year-to-year this quarter AMDs overall PC shipments declined 8.5%, Intel dropped 2.7%, Nvidia declined 18.7%, and VIA fell 82.4% from last year.
Total discrete GPU (desktop and notebook) shipments were roughly flat from the last quarter (up 0.12%) and down 18.8% from last year for the same quarter due to the same problems plaguing the entire PC industry. Overall the trend for discrete GPUs is down with a CAGR from 2012 to 2016 of -5.7%.
Ninety nine percent of Intels non-server processors have graphics, and over 67% of AMDs non-server processors contain integrated graphics; AMD still ships IGPs.
Year-to-year for the quarter, the graphics market decreased. Shipments were down 8.9 million units from this quarter last year.
Graphics chips (GPUs) and chips with graphics (IGPs, APUs, and EPGs) are a leading indicator for the PC market. At least one and often two GPUs are present in every PC shipped. It can take the form of a discrete chip, a GPU integrated in the chipset or embedded in the CPU. The average has grown from 1.2 GPUs per PC in 2001 to almost 1.4 GPUs per PC.
Pricing and Availability
The Jon Peddie Research’s Market Watch is available now in both electronic and hard copy editions, and sells for $2,500. Included with this report is an Excel workbook with the data used to create the charts, the charts themselves, and supplemental information. The annual subscription price for JPR’s Market Watch is $4,000 and includes four quarterly issues. Full subscribers to JPR services receive Tech Watch (the company’s bi-weekly report) and a copy of Market Watch as part of their subscription. For information about purchasing Market Watch, please call 415/435-9368 or visit the Jon Peddie Research website at http://www.jonpeddie.com.
About Jon Peddie Research
Dr. Jon Peddie has been active in the graphics and multimedia fields for more than 30 years. Jon Peddie Research is a technically oriented multimedia and graphics research and consulting firm. Based in Tiburon, California, JPR provides consulting, research, and other specialized services to technology companies in a variety of fields including graphics development, multimedia for professional applications and consumer electronics, high-end computing, and Internet-access product development. Jon Peddie’sMarket Watch is a quarterly report focused on the market activity of PC graphics controllers for notebook and desktop computing.