HIS Radeon 9600XT Video Card
Performance:
Our Test System:
- Intel 2.4C Processor (2449 MHz)
- ABIT AI7 Motherboard
- 1 Gb Kingston PC3500 RAM (dual channel)
- Maxtor/Quantum Fireball 40Gb HDD
- Thermaltake TruePower 360w Power Supply
Video Cards:
- HIS 9600XT 128mb (Default is 500/650)
- Chaintech FX5600U 128mb (Default is 400/800)
Testing Procedure:
Our test
set up includes Windows XP SP1a, DirectX 9.0b, Cat 3.10 driver for the
9600XT, and nVidia 53.03 driver for the 5600 Ultra. All benchmarks were
completed with no other software programs running. For overclocking the
video card, we used the RadClocker. The desktop resolution of our system
was set to 1024x768x32. A brief description of each test run will be provided
at the beginning of each test section.
Each
test was run 3 times in a row and the average is shown as the result.
We ran the following benchmarks:
3DMark2003 build 340 – NoAA and 4xAA at 10×7 and 12×10 resolutions- AquaMark 3 – NoAA and 4xAA at 10×7 resolution
- UT2003 v2225 – NoAA/NoAF and 4xAA/8xAF at 10×7 and 12×10 resolutions
- RTCW v1.41 – NoAA/NoAF and 4xAA/8xAF at 10×7 and 12×10 resolutions
- Halo v1.01 – NoAA/NoAF at 10×7 resolution
- Call of Duty – NoAA/NoAF and 2xAA/8xAF at 10×7 and 12×10 resolutions
Results:
3dMark2003 build 340:
UPDATE: We have been informed that we can not show you any 3dMark2003 results
which include use of the NVidia 53.03 WHQL certified driver. Since we
think using the current publicly available drivers for all our products
in our tests is most important, we have pulled the results for 3dMark2003
and will not be replacing the results with the use of a “drivers
that fulfill requirements of Futuremark Optimization Guidelines”.
A more detailed explanation can be found HERE.
The graph
shows the default scores, and the little chart below the graph shows the
results of all the settings we tested.
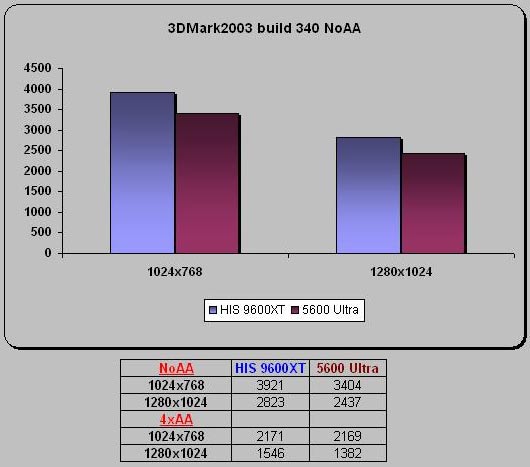
As you can see, the 9600XT has the performance edge over the 5600Ultra in this
test.
AquaMark3:
The graph
shows the default scores, and the little chart below the graph shows the
results of all the settings we tested.
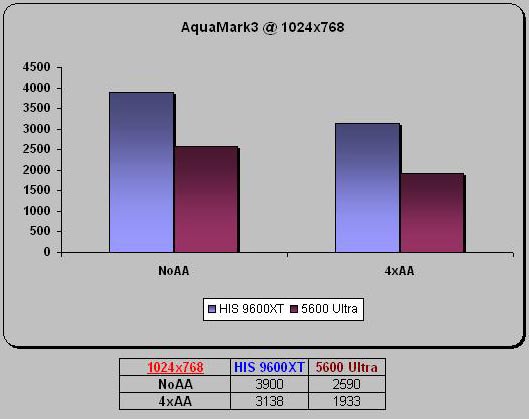
Again,
the 9600XT has a higher performance margin over its competition in this
test.
Next are some real gaming benchmarks!
Comments are closed.