ASUS G73Jh DX11 Gaming Notebook Review – ATI Mobility Radeon HD 5870
Cinebench and wPrime
Cinebench
CINEBENCH is the free benchmarking tool for Windows and Mac OS based on the powerful 3D software CINEMA 4D. Consequently, the results of tests conducted using CINEBENCH 10 carry significant weight when analyzing a computer’s performance in everyday use. Especially a system’s CPU and the OpenGL capabilities of its graphics card are put through their paces (even multiprocessor systems with up to 16 dedicated CPUs or processor cores). The test procedure consists of two main components; the first test sequence is dedicated to the computer’s main processor. A 3D scene file is used to render a photo realistic image. The scene makes use of various CPU-intensive features such as reflection, ambient occlusion, area lights and procedural shaders. In the first run, the benchmark only uses one CPU (or CPU core), to ascertain a reference value. On machines that have multiple CPUs or CPU cores, and also on those who simulate multiple CPUs (via HyperThreading or similar technologies), MAXON CINEBENCH will run a second test using all available CPU power. Again, higher Frames/Second and lower rendering time in seconds equal better performance.

Results: The raw horsepower of the Intel Core i7 720QM found in the ASUS G73Jh really shows in Cinebench R10’s x-cpu test over the Core 2 Duo T9600 CPU found in the ASUS N81Vp.
Cinebench R11.5
MAXON recently released CINEBENCH Release 11.5, an advanced hardware testing suite that assesses a computer’s performance capabilities. CINEBENCH is based on the same powerful technology as MAXON’s award-winning animation software CINEMA 4D, which is used extensively by studios and production houses worldwide for 3D content creation. The new version of CINEBENCH includes the ability to more accurately test the industrys latest hardware, including systems with up to 64 processor threads, and the testing environment better reflects the expectations of todays production demands. A more streamlined interface makes testing systems and reading results incredibly straightforward. Again, higher Frames/Second and point score equal better performance.
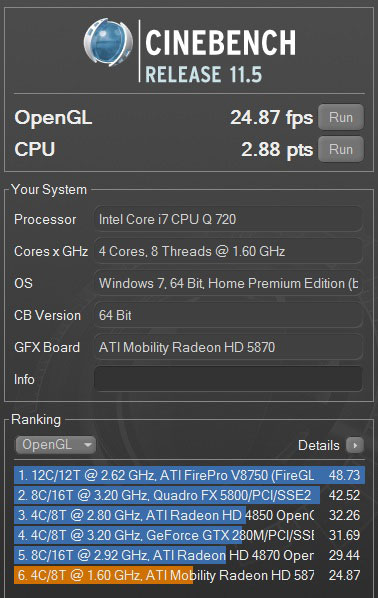
Benchmark Results: With this being the first system we have run Cinebench R11.5 on, we unfortunately do not have any other notebooks to compare it to. But glancing at some desktop performance numbers, it seems these results fall in line with what we would expect from a mobile system. We look forward to comparing other systems with these numbers in future reviews.
wPrime
wPrime uses a recursive call of Newton’s method for estimating functions, with f(x)=x2-k, where k is the number we’re sqrting, until Sgn(f(x)/f'(x)) does not equal that of the previous iteration, starting with an estimation of k/2. It then uses an iterative calling of the estimation method a set amount of times to increase the accuracy of the results. It then confirms that n(k)2=k to ensure the calculation was correct. It repeats this for all numbers from 1 to the requested maximum.

Results: Here we get expected results with wPrime showing the ASUS G73Jh is slightly slower than the Clevo simply due to the processor max speed differences.
Comments are closed.