Albatron FX5900 XTV
Test Setup:
Hardware
- Intel 2.4C
- ABIT AI7
- 1Gb Kingston PC3500 RAM (dual channel)
- Maxtor/Quantum Fireball 40Gb HDD
- Thermaltake PurePower 360W PSU
Video Cards
- Albatron FX5900 XTV 128mb (Default is 390/700)
- ASUS A9600XT/TVD 128mb (Default is 500/600)
Testing Procedure
Our test setup includes Windows XP SP1a, DirectX 9.0b, Forceware 56.64 driver for the 5900XT and Cat 4.3 driver for the 9600XT. All benchmarks were completed with no other software programs running. For overclocking the Albatron FX5900 XTV, we used the Coolbits registry tweak. The desktop resolution was set to 1024x768x32. A brief description of each test will be provided at the beginning of each test section. Each test was run 3 times in a row and the average was taken as the result shown in our graphs. In the game tests, FRAPS was used to acquire the data points used in the line graphs, while the FPS score was taken from each game’s timedemo results. We ran the following tests:
- Synthetic Benchmarks
- 3dMark2001SE build 330
- AquaMark3
- ShaderMark v2.0 build 1e
- D3D FableMark v1.0
- Fill Rate Tester
- Spec Viewperf 7.1.1
- UT2003 v2225
- RTCW v1.41
- Halo
- Call of Duty
- Halo
- Call of Duty
- 3dMark2001SE build 330
- UT2003 v2225
- Halo
Synthetic Tests
3dMark2001SE build 330
3dMark2001SE was run at default setting – 1024×768 and NoAA (shown in the graph), along with 1024×768 and 4xAA, 1280×1024 and NoAA, and 1280×1024 and 4xAA. AA was set through the software.
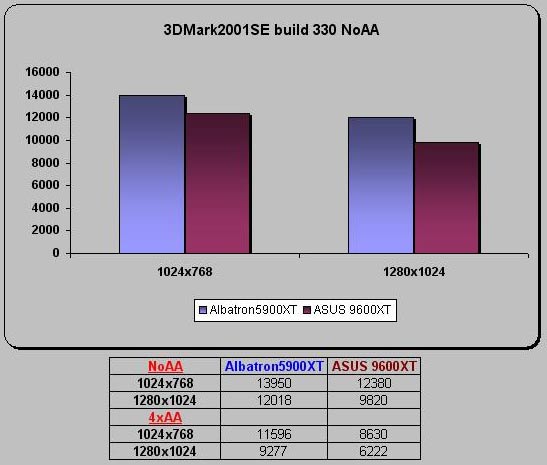
3dMark2001SE shows that the Albatron 5900XT has a little lead on the 9600XT. It is worth pointing out that the difference in points gets greater as the graphics quality gets more difficult. There is about a 3000 point difference at 4xAA 1280×1024, whereas there is only a 1600 point difference at NoAA 1024×768. This could signify that the FX5900XT can handle AA better than the 9600XT.
I will also note here that the visual quality of the Nature test was noticeably diminished due to how bright the sunlight appeared on the screen. This adverse affect further backs up the lighting issues found in various games run on GeForce FX hardware. This was, however, the only test which was noticeably affected by these lighting issues.
AquaMark3
AquaMark3 was run at 1024×768 with NoAA and 4xAA set through the driver.
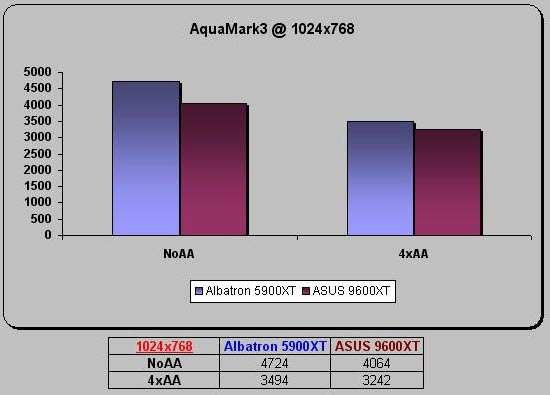
We again see the 5900XT score is better than the 9600XT, but in this benchmark, the performance gap closes as you increase AA. This gives a little perspective on how these synthetic benchmarks test different areas of a graphics card.
ShaderMark v2.0 build 1e
ShaderMark was run at 1024×768 with NoAA.
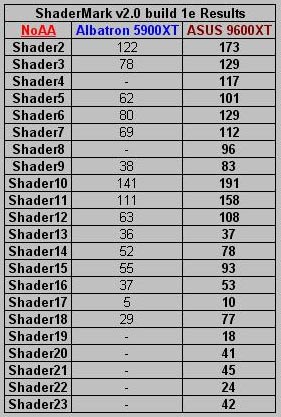
When we ran ShaderMark, we got a series of warnings about how certain shaders were not supported by our current hardware. Those shaders that were not supported received no score. What is more interesting is how the shaders that were supported received a much lower score, overall, than the 9600XT. This could mean that the shader technology in the 9600XT is superior to the 5900XT.
D3D FableMark v1.0
FableMark is a quick little benchmark that is great for testing stencil edges. We tested the 9600XT’s at 1024×768 with NoAA and 4xAA/8xAF set through the driver.
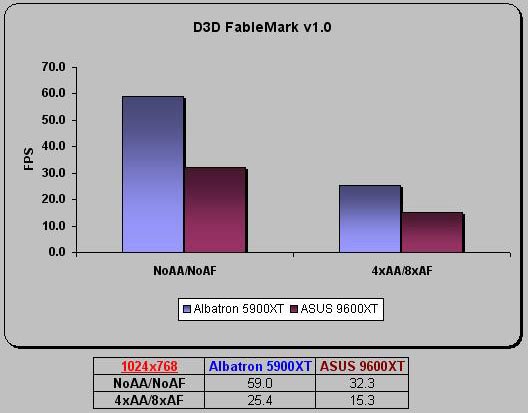
FableMark shows us that the 5900XT does much better than the 9600XT at drawing stencil edges.
Fillrate Tester
Fillrate Tester was run using Display Mode 1024×768 @ 85Hz. No other changes to the settings were done.
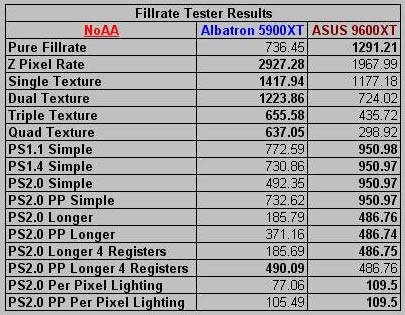
This fillrate tester does a great job in this comparison. This test clearly shows how the different brand cores perform better at different things. It shows us that the 9600XT does better at PS1.1, PS1.4, and PS2.0, which backs-up our results from ShaderMark. However, the 5900XT does better at textures, which agrees with our results from FableMark.
Comments are closed.