8 SSDs Tested on AMD X570 Platform with PCMark 10 Storage Benchmark
Legit Reviews Builds New SSD Test System
One of the things that Legit Reviews has been working on behind the scenes this month is building up a new SSD test system for improving the way we benchmark storage drives. With more PCIe Gen 4.0 drives getting ready to enter the market we figured that it was time to jump ship from Intel to AMD. AMD was the first company to offer PCI Express Gen 4.0 support with the introduction of the X570 platform in the middle of 2019 and it has been a hot topic ever since. Intel has not announced when they will release a desktop platform that supports PCIe Gen 4.0. Rumor has it that PCIe Gen 4.0 will not be included on the upcoming Z490 motherboards that will be released when Intel 10th Gen ‘Comet Lake-S’ processors come to market later this year. So, moving over to the AMD X570 platform for storage testing made sense for the site as we need to have relevant data for our readers on the products that are selling right now.
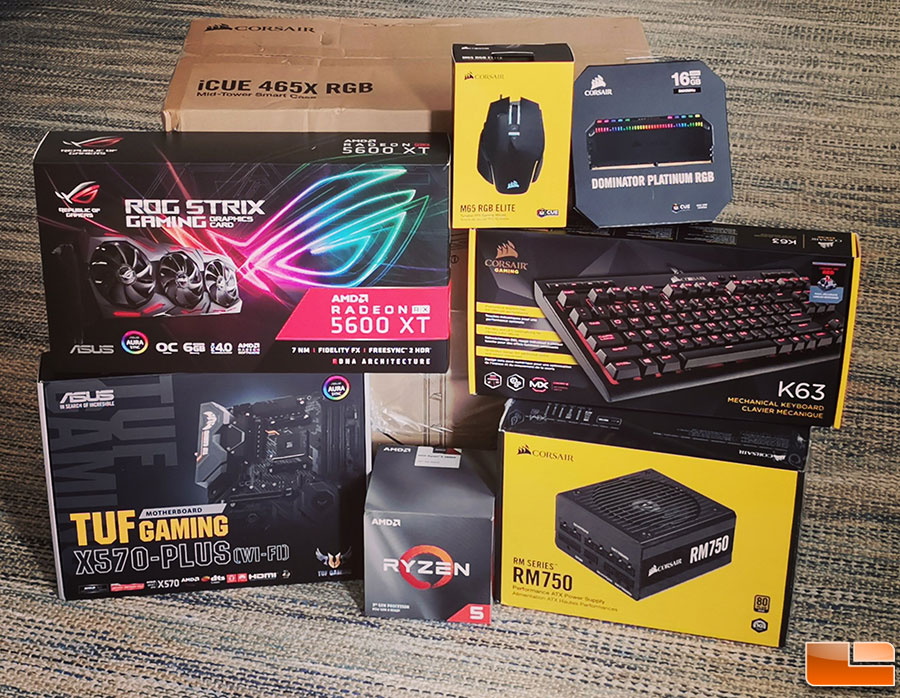
When building storage test platforms we always aim for the middle of the road. The goal here is to have a system that relates to the average Do-It-Yourself (DIY) builder, gamer or enthusiast as we want the benchmark results to mean something. To power the system we picked the AMD Ryzen 5 3600X 6-core, 12-thread processor as it along with the Ryzen 5 3600 are hands down two of the best selling 3rd Gen Ryzen CPUs. The AMD Ryzen 5 3600X runs $204.99 shipped and the Ryzen 5 3600 is $174.99 shipped. We went with the ASUS TUF Gaming X570-Plus (Wi-Fi) motherboard ($183.99 shipped) and the ASUS ROG STRIX Gaming Radeon RX 5600 XT graphics card ($339.99 shipped). DRAM needs are fulfilled by a 16GB DDR4-3600 kit of Corsair Dominator Platinum RGB memory ($159.99 shipped) and a Corsair RM750 power supply ($119.99 shipped) powers the system. All that was placed into the Corsair iCUE 465X RGB Black case ($129.99 shipped) without issue. We went with the compact Corsair K63 mechanical keyboard ($73.99 shipped) to keep the lab bench as open as possible and the M65 RGB Elite gaming mouse ($39.99 shipped).
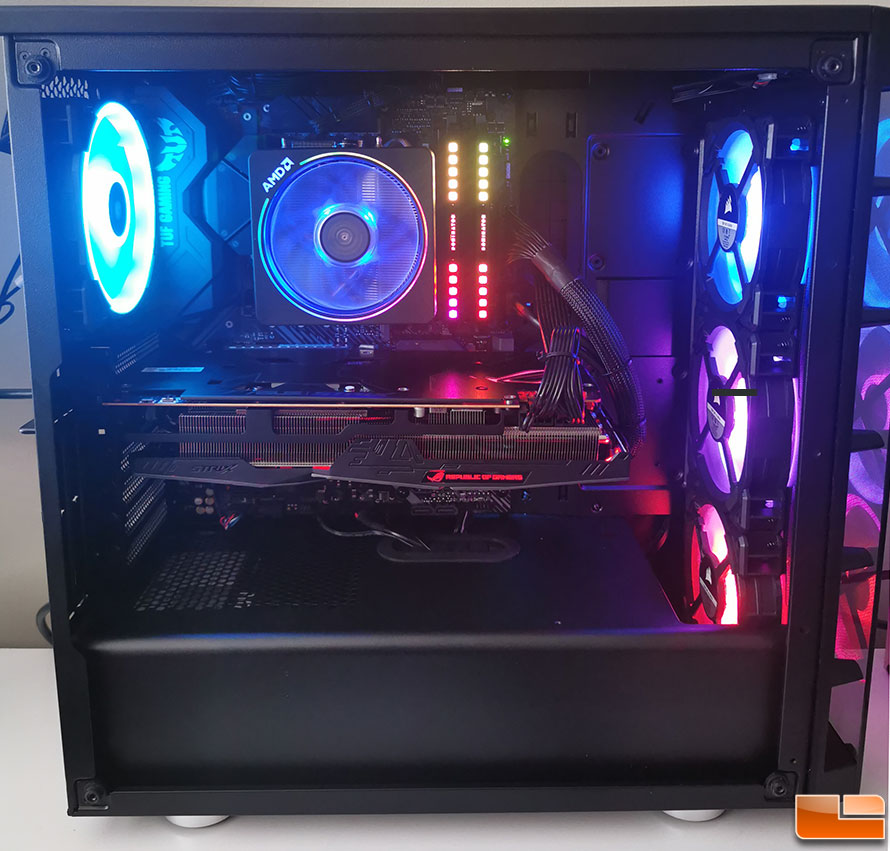
The total build cost is around $1,250 and that seems like a fair price for a system of this caliber and it should also look good thanks to RGB everything. Our previous test system was done on an open test bench, but we had people wanting to know about thermal performance inside an enclosure. So, we built the new SSD test system for 2020 in a case not only to show thermal performance, but to also better mimic real world usage scenarios. Thermal throttling can impact SSD performance, so we’ll be doing all of our testing with the tempered glass side panel on this year. An image of the finished build can be seen below. You’ll notice that we did add a rear Corsair LL Series LL120 RGB fan to improve the chassis airflow and went with the AMD Wraith Prism LED RGB CPU cooler since it looked better.
Our decisions seemed solid when we were piecing the build together, but you never really know how things will work out until you complete the build. Luckily, everything came out great as it is fairly solid and the DDR4-3600 memory had no issues being setup on this ASUS X570 board. It has been a hot minute since we’ve used an ASUS TUF Gaming series motherboard on a regular basis, so we overlooked the fact that it does not support ASUS Secure Erase in the UEFI/BIOS. Since this is an SSD storage test system that is kind of a big deal and it was a feature ASUS first introduced back in 2013 on their ROG motherboard series. It seems that ASUS is still using that as a differentiation between the TUF and ROG series here in 2020. So, we’ll be using Parted Magic ($11 for the latest build or $39 per year) on a USB Drive to secure erase all the drives we test. Windows 10 Pro version 1909 was clean installed and setup without issue.
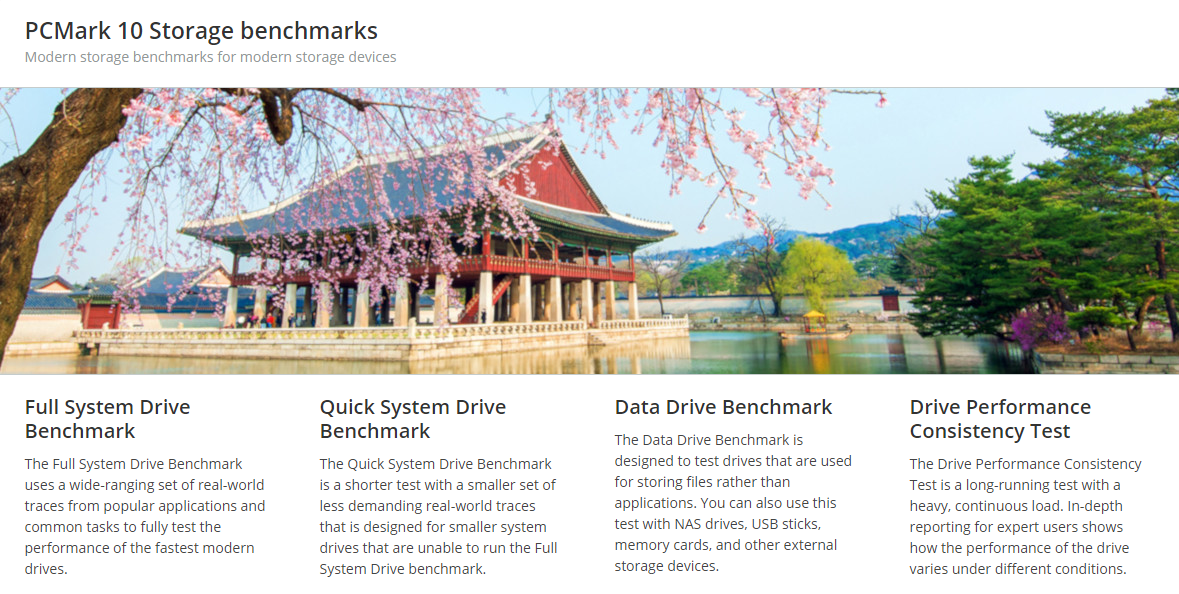
PCMark 10 Storage Benchmarks
We’ve been busy behind the scenes with the tedious task of re-testing many of the drives that we’ve been sampled over the past couple years. That means each drive was secure erased and had its firmware updated if a newer build was available. The move over to a new test system also gave us the chance to update and improve our test suite. One of the big wishes from the community that we’ve heard loud and clear is that we need to move from PCMark 8 to PCMark 10.
PCMark 8 was originally introduced in 2013 and the storage test uses only one thread to do everything. We are by no means living in the single-core era thanks to corporations like AMD offering CPUs with higher core counts than ever before. PCMark 10 Storage uses all the CPU cores available on the platform being tested and has been validated to support up to 5GB/s bandwidth. About half the available cores/threads are being used for generating the data needed for I/O and the other half are tasked with sending out I/Os. The I/O in both PCMark 8 and PCMark 10 is asynchronous. That means that the thread sending an I/O does not sit waiting for it to complete, but can instead queue more I/O to match the queue depth in the recorded trace. The CPU thread count used by the benchmark does not equal to the queue depth seen by the storage device. Most modern software has been written to be a muilthreaded solution where it can push IOs from multiple threads. This should play top the strengths of NVMe devices that have come out in recent years as they were designed to handle multiple queues at the same time. So, the take home message here is that PCMark 10 takes advantage of all available threads and uses newer real-world traces.
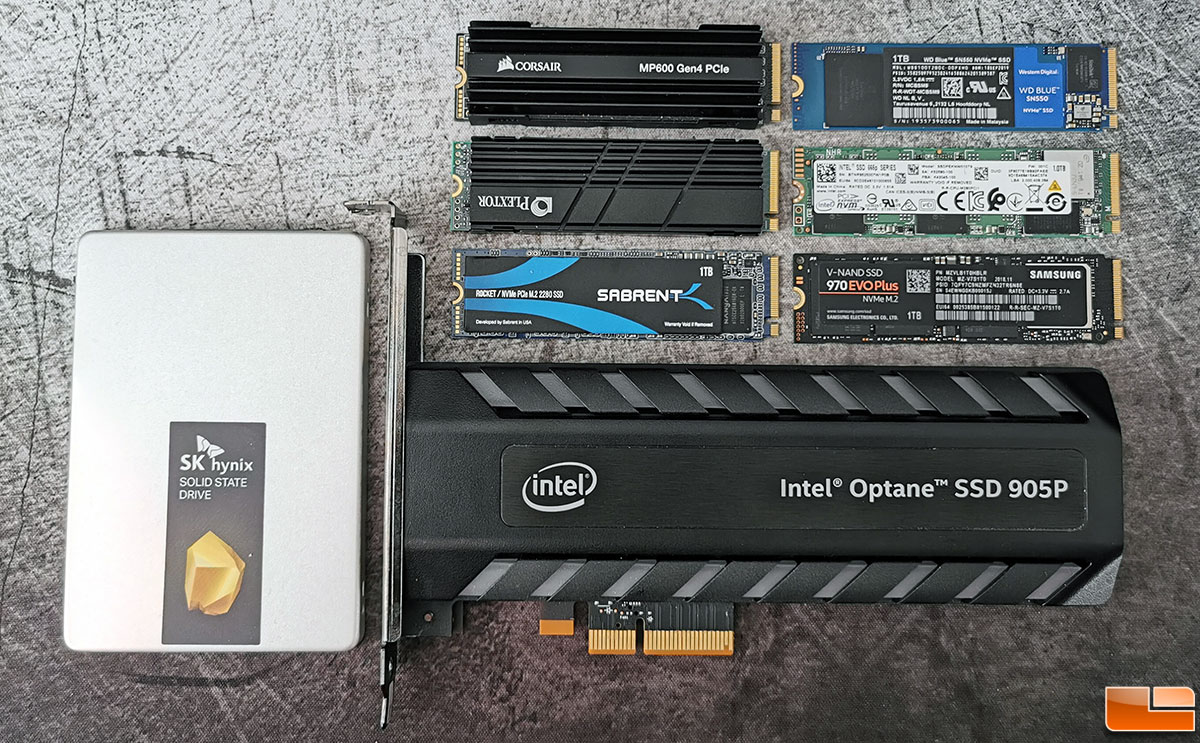
We started off testing 960GB to 1TB SSDs on the new system since that is one of the most popular capacities for enthusiasts right now. The first eight storage drives that we tested on the new SSD test system are listed below along with the respective firmware that they were tested with.
- Corsair Force MP600 Gen4 PCIe 1TB – $241.70 shipped
- Phison E16 controller w/ BiCS4 96-Layer TLC
- Firmware EGFM11.3
- Plextor M9P+ 1TB – $134.99 MSRP
- Marvell 88SS1092 controller w/ BiCS4 96-Layer TLC
- Firmware 1.01
- Sabrent Rocket 1TB – $139.99 shipped
- Phison E12 controller / BiCS4 96-Layer TLC
- Firmware RKT303.2
- WD Blue SN550 1TB – $128.74 shipped
- WD in-house controller w/ BiCS4 96-Layer TLC
- Firmware 211050WD
- Intel SSD 665p 1TB – $129.99 shipped
- SMI 2263EN controller w/ Intel 96-Layer QLC
- Firmware 001C
- Samsung SSD 970 EVO Plus 1TB – $199.99 shipped
- Samsung Phoenix controller w/ Samsung 9x-layer V-NAND TLC
- Firmware 2B2QEXM7
- Intel Optane SSD 905P 960GB – $1,276.99 shipped
- Intel SLM58 controller w/ Intel 3D XPoint
- Firmware E2010420
- SK Hynix Gold S31 1TB – $105.99 shipped
- SK Hynix ‘Quartz’ controller w/ SK Hynix 3D-V4 72-layer 3D TLC
- Firmware 900000Q00
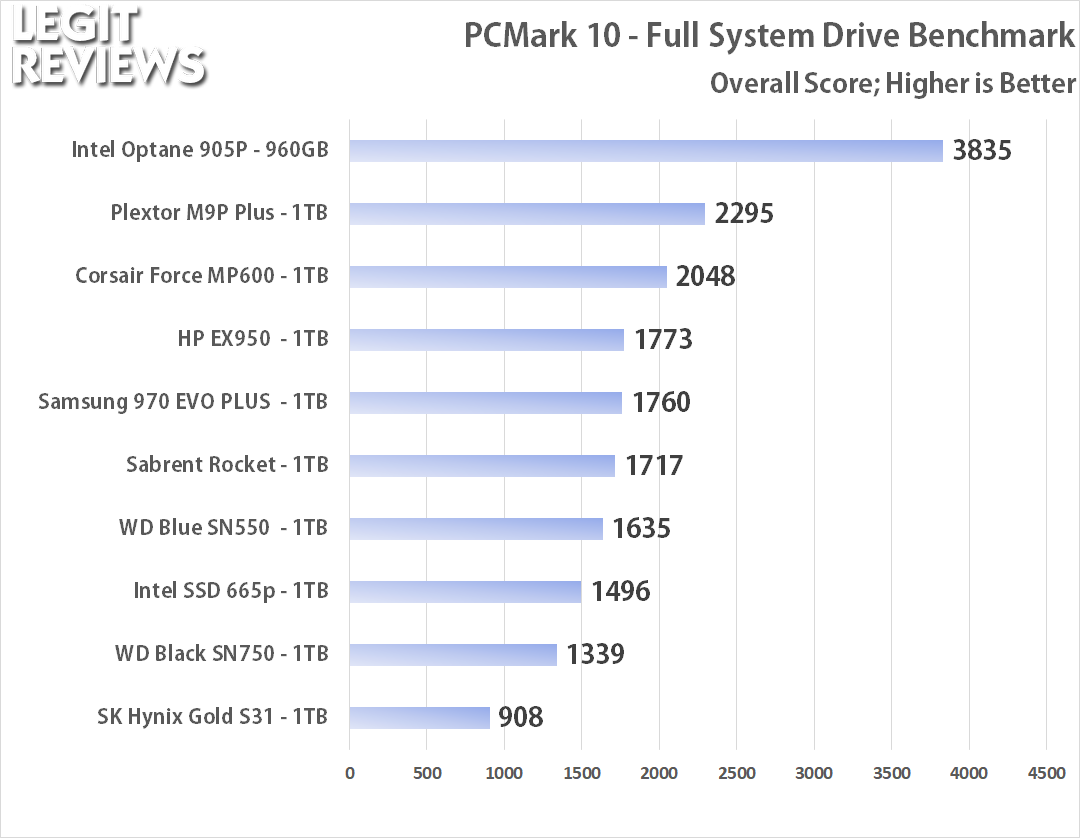
PCMark 10 – Full System Drive Benchmark Results:
The first test that we will be running is the PCMark 10 Full System Drive Benchmark. This benchmark uses a wide-ranging set of real-world traces from popular applications and common tasks to fully test the performance of the fastest modern drives. The goal of the benchmark is to show meaningful real-world performance differences between fast storage technologies such as SATA, NVMe, and Intels Optane. The Full System Drive Benchmark uses 23 traces, running 3 passes with each trace. Some of the traces include booting Windows 10 and start times for games titles Battlefield V, Call of Duty Black Ops 4, and Overwatch. It typically takes an hour to run and the number of bytes written to the drive during test with default settings is 204 GB.

On the full system drive benchmark the results show the Intel Optane 905P 960GB drive dominating the other drives as it should since it is the highest priced drive of the group. The Plextor M9P Plus (PX-1TM9PG+) at $134.99 does extremely well on this benchmark as it was able to top the Corsair Force MP600. The Corsair Force MP600 is the lone PCIe Gen 4.0 x4 drive of the group, so many might have expected it to be the winner by a long shot. The SK Hynix Gold S31 is the only SATA III SSD in the group and it comes in last place as one might expect.
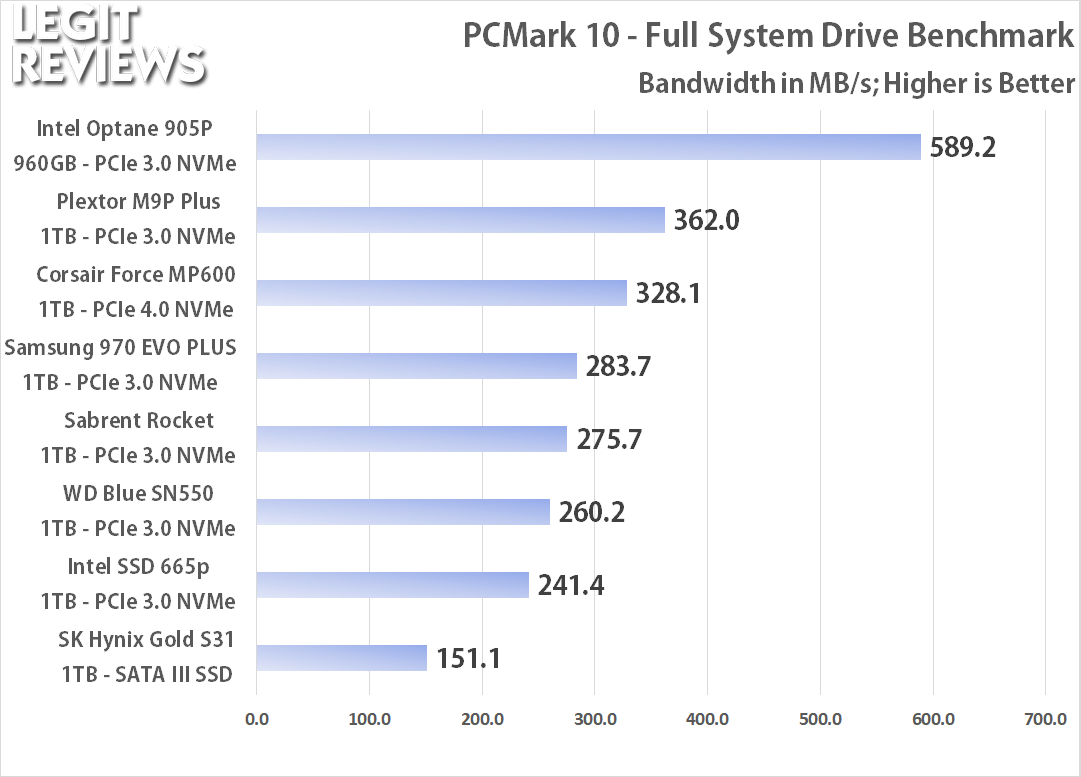
The PCMark 10 Storage Benchmarks overall score is calculated from the bandwidth and average access time sub-scores. The bandwidth subtest is defined by UL in PCMark 10 as bandwidth = bytes / busy_time_for_read_and_write. Here we see nice scaling as the SATA III drive got around 150 MB/s, the NVMe drives running tradidional NAND Flash were around 200-400 MB/s and then the only 3D Xpoint drive of the group was pushing close to 600 MB/s.
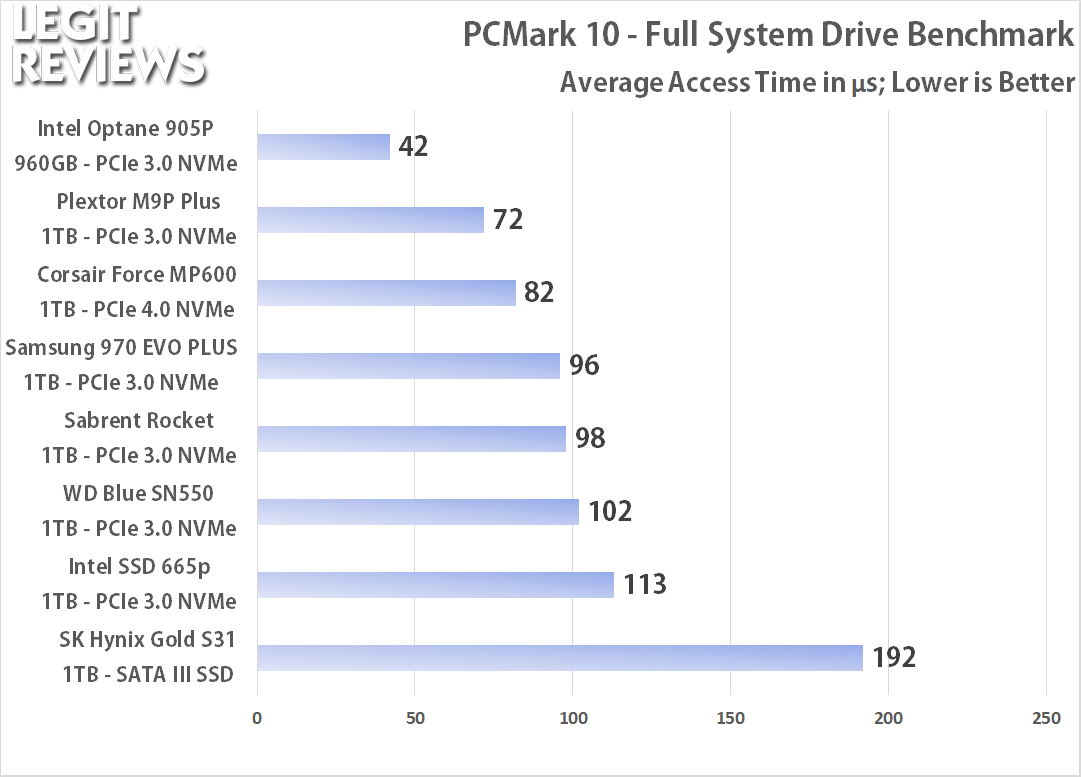
The final subtest result is the average access time. During a trace playback in PCMark 10, the start and end time is measured for each I/O. So, the average access time is derived from the end time of an I/O subtracted from the start time of that operation. Once again the Intel Optane 905P 960GB drive dominates and has nearly 5x lower average access times than the SK Hynix S31 Gold drive that uses the SATA III interface.
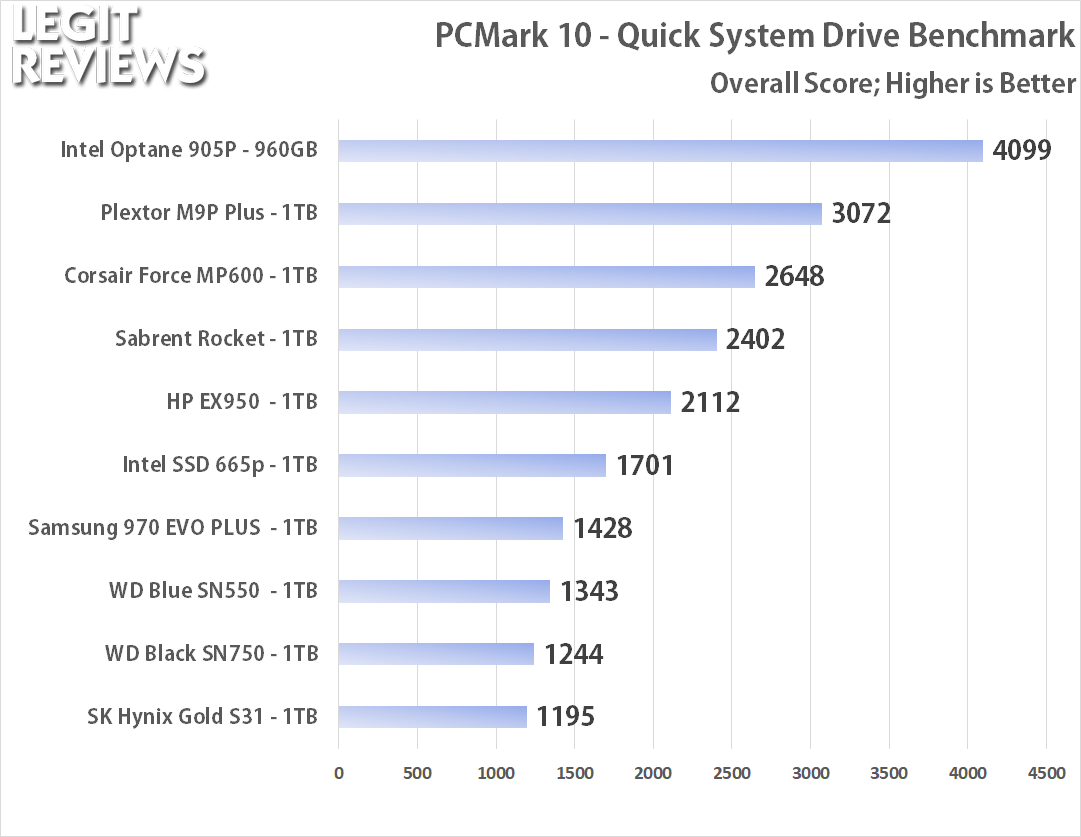
PCMark 10 – Quick System Drive Benchmark Results:
The second and final test that we will be running is the PCMark 10 Quick System Drive Benchmark. The Quick System Drive Benchmark is a shorter test with a smaller set of less demanding real-world traces. This benchmark is better suited for testing entry performance
level and lower capacity drives in less demanding use scenarios. The benchmark is designed to measure the performance of small system drives from traditional spinning drives (HDDs) at the low end and entry-level PCI Express SSDs at the high end. The Quick System Drive Benchmark uses 6 traces, running 3 passes with each trace. Three of the traces involve copying JPEG images and the other three use Microsoft Excel, Adobe Illustrator, and Adobe Photoshop. It typically takes 20 minutes to run and the number of bytes written to the drive during test with default settings is 23 GB.
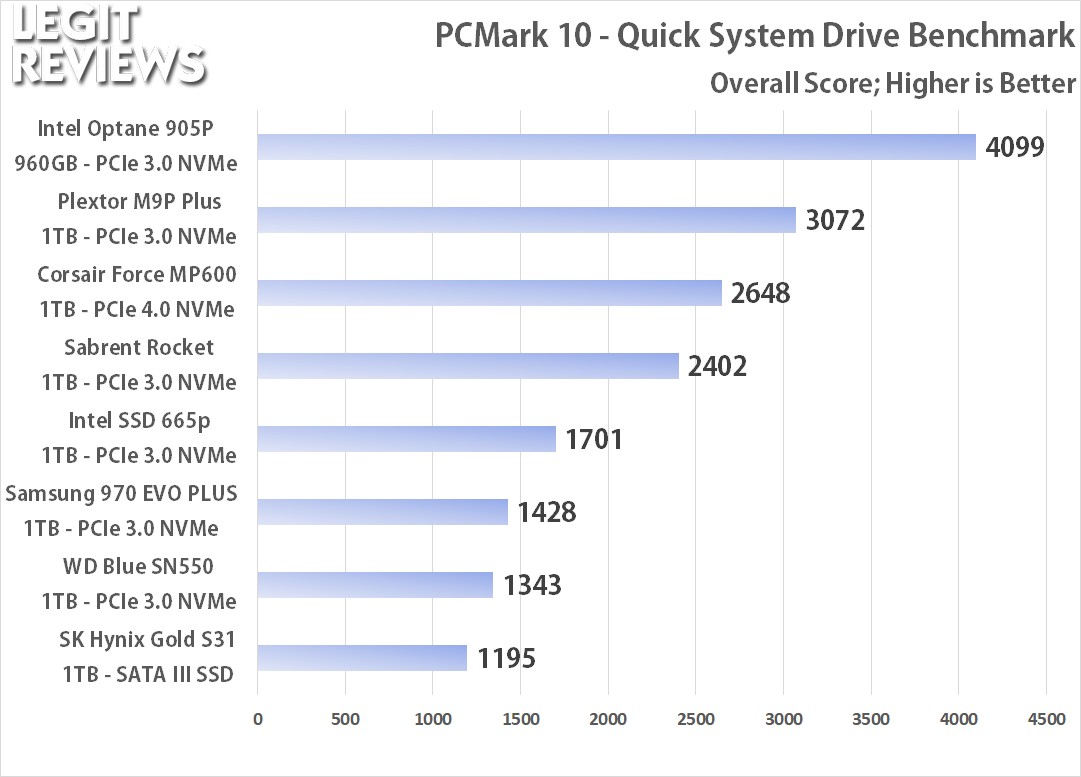
The results here are mostly the same on the top and bottom, but we do see some drives perform differently in the middle. The big movers were the Samsung 970 EVO Plus 1TB and the Intel SSD 665p 1TB SSDs. The Samsung drive performed worse than expected and moved down two spots whereas the Intel SSD 665p performed better than expected and moved up two spots.
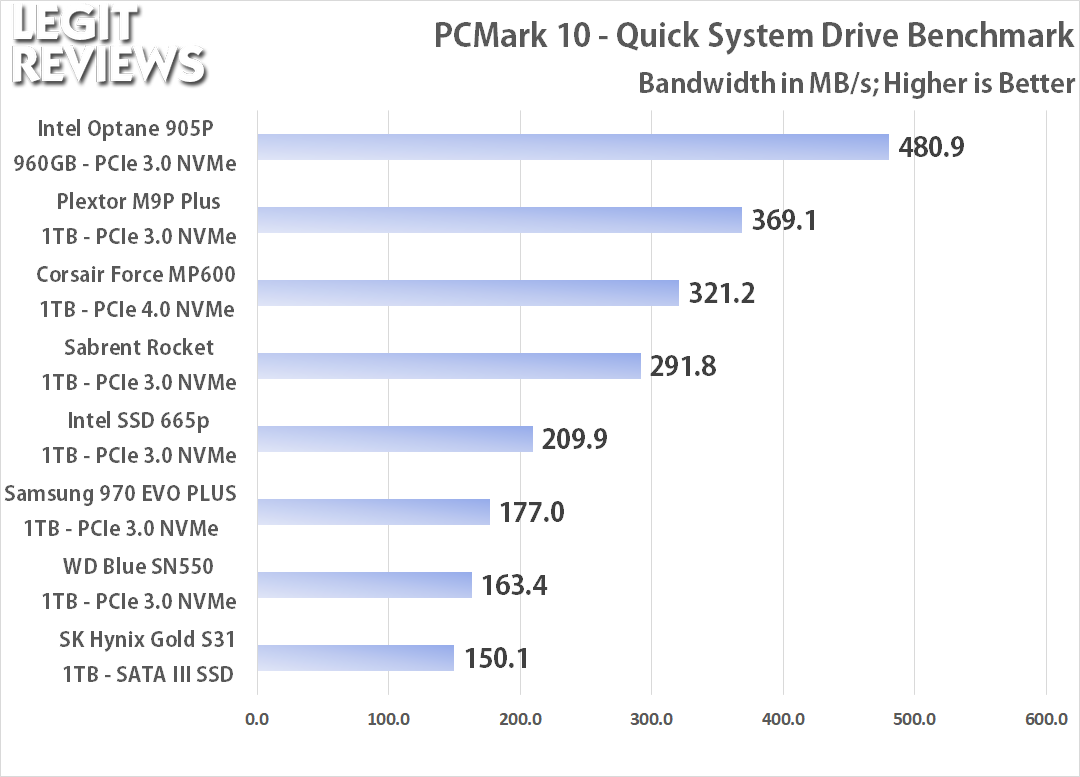
The vast majority of the drives had lower bandwidth speeds in the quick system tests with the exception of the Plextor M9P Plus and the Sabrent Rocket.
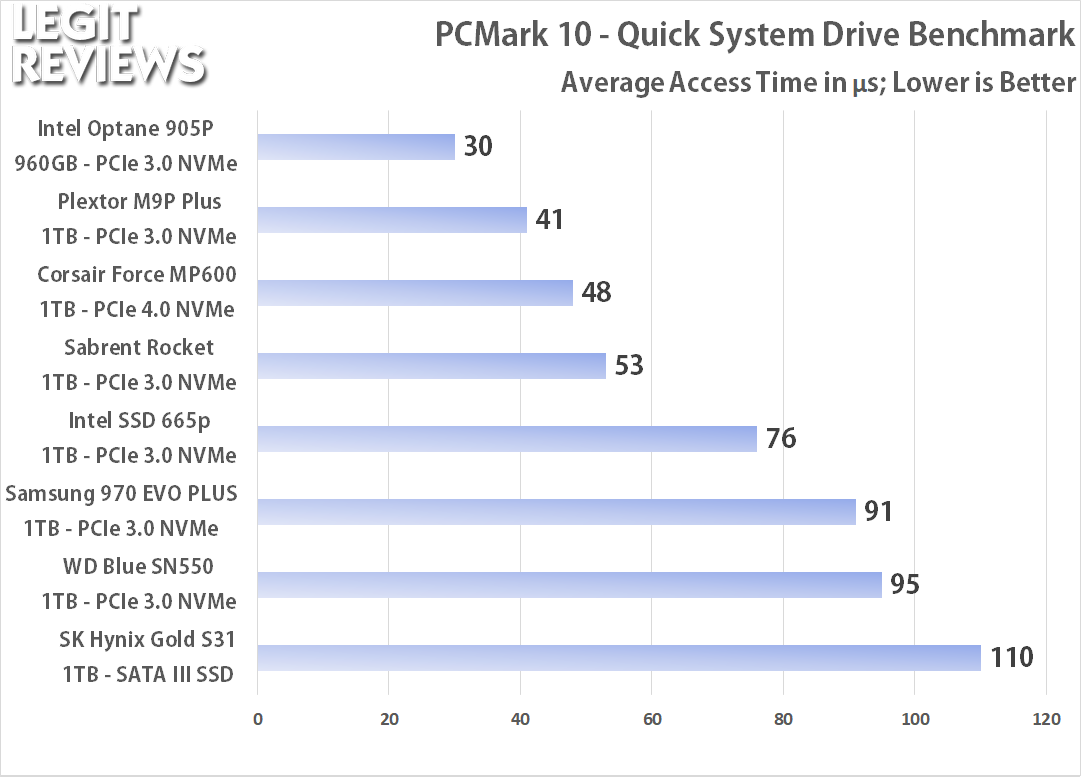
The average access times were lower on the PCMark 10 Quick System Drive benchmark and show some great scaling as you can see from the table above.
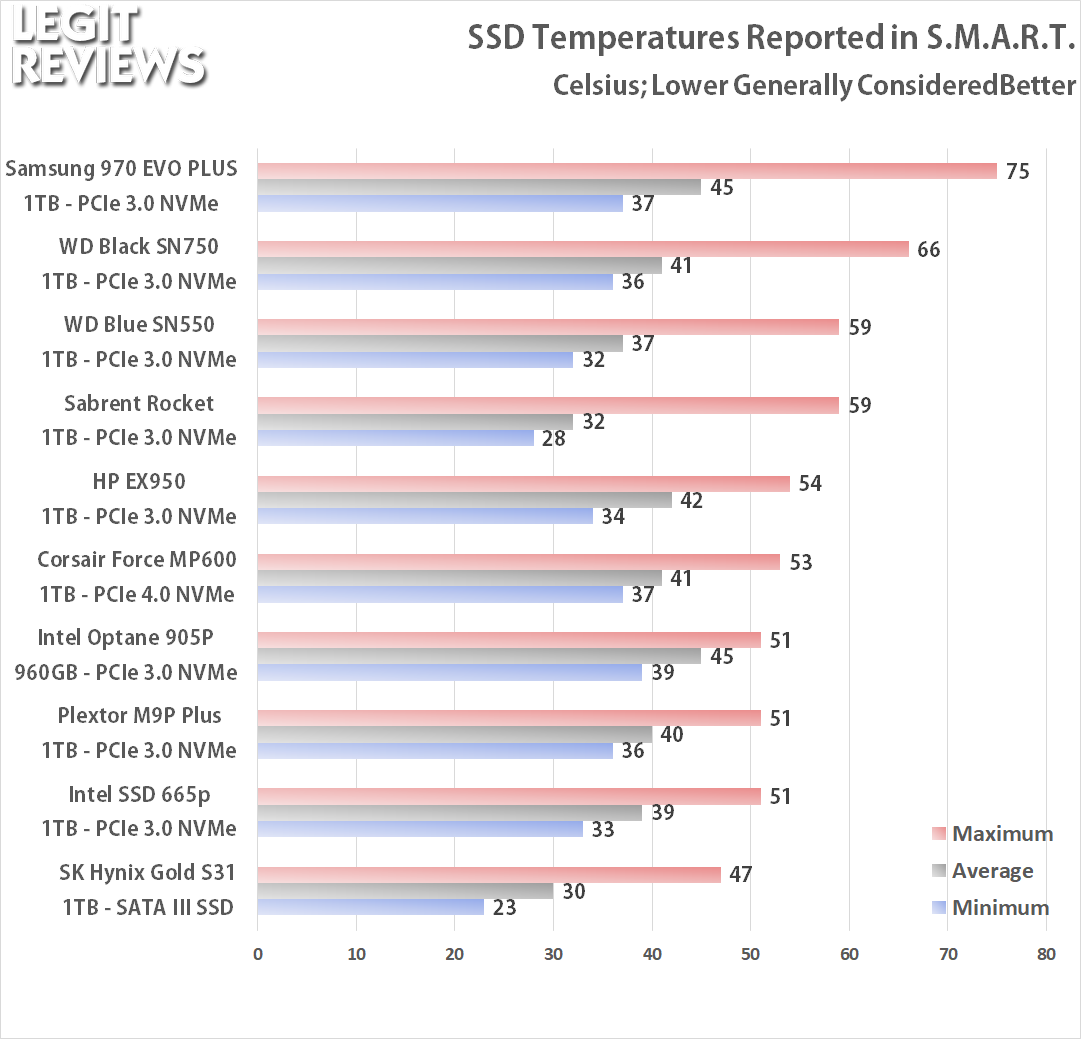
SSD Temperature Testing
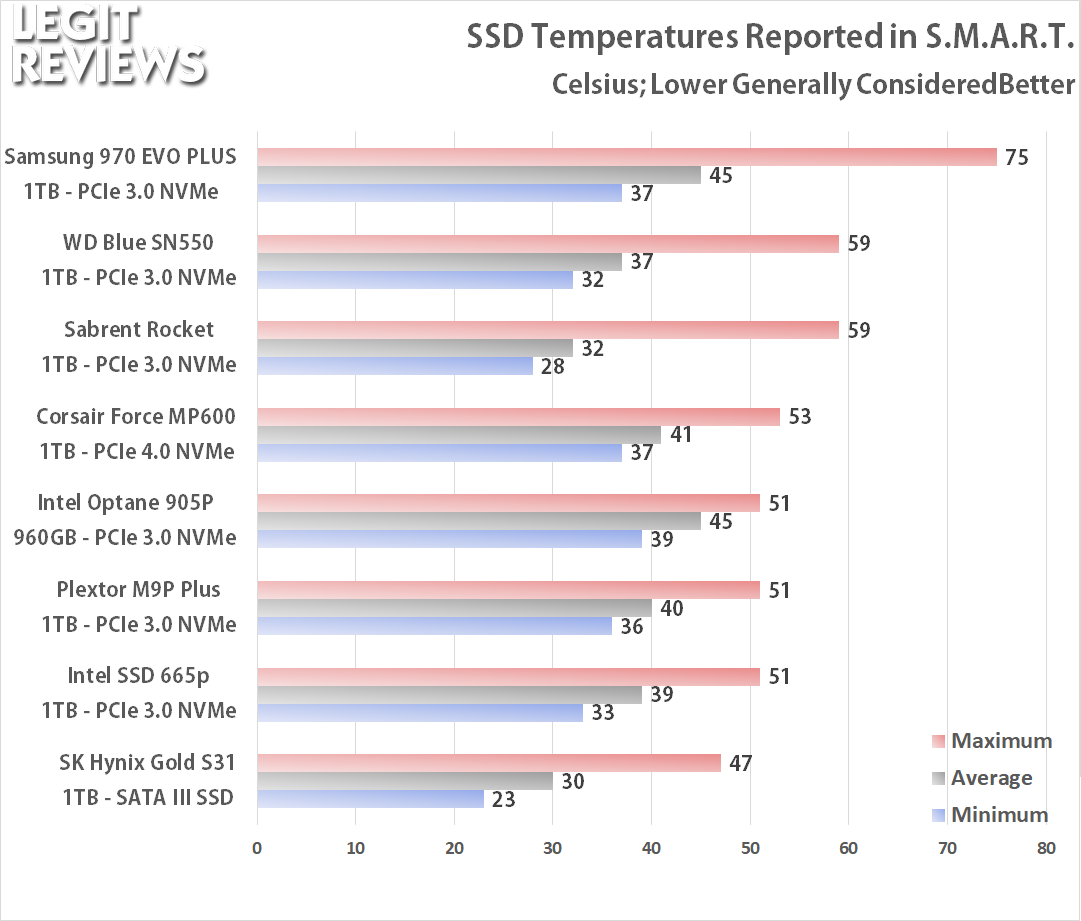
When it comes to SSD temperature testing we figured out that this is a really tricky thing to measure and that is why most review sites don’t show temperature results. At first we were going to use the minimum and maximum temperatures reported by S.M.A.R.T. and call it a day. That looked good, but while looking closer at the data we noticed that some of the drives with the highest peak value actually averaged out to be much cooler over our entire test suite that takes over three hours per pass to complete. For example, the Intel Optane 905P 960GB drive has the second lowest maximum temperature, but it also has the highest average temperature. The Sabrent Rocket was seen having the second highest maximum temperature, but the average temperature was the lowest of any NVMe SSD. Seeing high temperatures on a drive might persuade someone not to buy that particular model, so the average temperature result seems to be very important to include.
The other thing that complicated matters is that several of the drives were reporting two temperatures. We reached out to our PR and engineering contacts at the seven companies that make these eight drives and stumped some of them as to what each sensor is exactly reading. We ended up charting the first sensor reported to make the chart above and the ambient room temperature at the time of testing was 21C or right around 70F.
Final Thoughts
We just wanted to let our community know what we have been working on behind the scenes and this is just a quick look at a couple of the new things that we are doing. The new SSD test system will be heavily used in the months ahead and we look forward to providing the community with a better look at the storage drives that are available for purchase. The goal of this site has to always provide you with the best information in order to allow you to make the right purchasing decisions. By moving to the AMD X570 platform we hope that we are able to do that for our readers and all those that they influence.
Some new and exciting SSDs are on the way this year and we’ll be doing our usual full storage reviews on them. Expect to see all of the new updated benchmarks numbers later this month when our first reviews using the new test system are posted.
If you have any comments or feedback on how SSDs are tested please let us know in the comment section below. We are always looking for community feedback and enjoy the interaction!
UPDATE (02/18/2020): We have had several people ask about the performance on drives using the Silicon Motion 2262EN controller and the WD_Black SN750 since this article was posted. We have tested the HP EX950 1TB and WD Black SN750 1TB drive and have created a few new charts to show those results below.
- HP EX950 1TB – $139.99 shipped
- SMI 2262EN controller / IMFT 64-Layer TLC
- Firmware FWR1106C
- WD Black SN750 1TB – $149,99 shipped
- WD in-house controller w/ BiCS3 64-Layer TLC
- Firmware 102000WD