Behind Closed Doors: Power Supply Pricing Guide
R2 Values
In statistics, a value is often required to determine how closely a certain function fits a particular set of experimental data. In this module, we have relied on the R2 value computed in Excel to determine how closely our data conform to a linear relationship. R2 values range from 0 to 1, with 1 representing a perfect fit between the data and the line drawn through them. On the reverse, if the data points are very far from the line, the R2 value approaches 0. We again took our data set and plugged them into a single series and used a trendline to help figure out which, if any, of our data sets is the closest to being right.
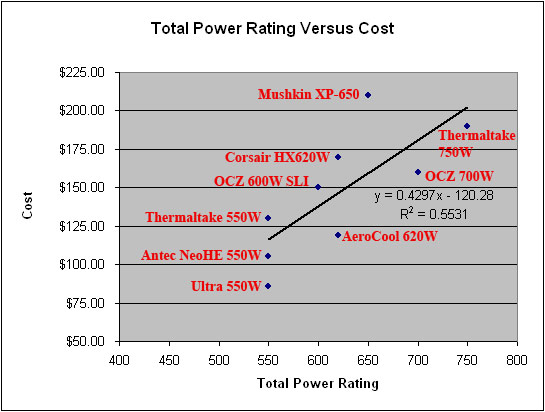
The old way of thinking is that the total power rating is the way to price power supplies. We asked several companies if pricing is still based around the total power rating and none said it was. When talking with Antec, Corsair, OCZ, Mushkin, Ultra and other companies we would get statements like this back when asking it the total power rating was the method used; “I don?t think it?s quite as simple as this. In order to get a good comparison you?d need to bring other features into consideration as they have a direct bearing on cost.” or “The selling prices you see are primarily derived from manufacturing costs. I mean, a few brands mark up a little more because of brand name recognition, longer warranty, better support, etc. But primarily, it’s a manufacture cost thing”. When looking at the total power rating our R2 value was 0.55. Let’s see if we can do better.
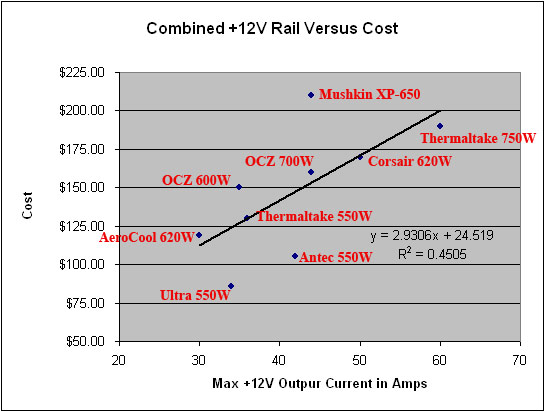
In the next test we ran the Amperage on the combined +12V rails and compared it to pricing. One person in the industry e-mailed Legit Reviews and said; “I think the +12V rail max amperage rating is the key right now for power output ratings.” After plugging the data in we found an R2 value of 0.45, which is lower than the 0.55 that we got for the total power rating. The more Amps on the +12V rail does seam to impact prices.
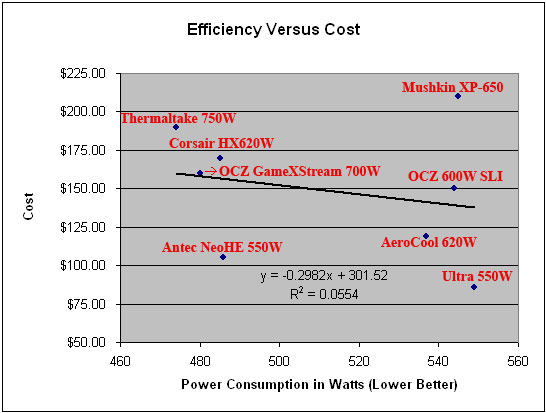
In our last test we used the total power consumption numbers that we obtained using a power meter where the units plugged into the wall at. With everyone becoming green friendly we thought it would be interesting to see if companies are charging more or less for energy efficient power supplies. An experiment obtaining very low R2 values of 0.1 or less, suggests that the experimental model did not account for much of the variation. As the above graph shows energy efficiency really has nothing to do with the pricing for our test group. I actually find it funny that most expensive power supply is also one of the least efficient.
Comments are closed.