ASUS Radeon 9600XT/TVD
Test Setup
Test Setup
Hardware
- Intel 2.4C
- ABIT AI7
- 1Gb Kingston PC3500 RAM (dual channel)
- Maxtor/Quantum Fireball 40Gb HDD
- Thermaltake PurePower 360W PSU
Video Cards
- ASUS A9600XT/TVD 128mb (Default is 500/600)
- HIS 9600XT Turbo 128mb (Default is 500/650)
- Chaintech FX5600U 128mb (Default is 400/800)
Testing Procedure
Our test setup includes Windows XP SP1a, DirectX 9.0b, Cat 4.2 driver for the 9600XT’s and nVidia 53.03 driver for the 5600 Ultra. All benchmarks were completed with no other software programs running. For overclocking the ASUS 9600XT, we used the Rage3D Tweak Utility. The desktop resolution was set to 1024x768x32. A brief description of each test will be provided at the beginning of each test section. Each test was run 3 times in a row and the average was taken as the result shown in our graphs. In the game tests, FRAPS was used to acquire the data points used in the line graphs, while the FPS score was taken from each game’s timedemo results. We ran the following tests:
- Synthetic Benchmarks
- 3dMark2001SE build 330
- AquaMark3
- ShaderMark v2.0 build 1e
- D3D FableMark v1.0
- Fill Rate Tester
- Spec Viewperf 7.1.1
- UT2003 v2225
- RTCW v1.41
- Halo
- Call of Duty
- Halo
- Call of Duty
- 3dMark2001SE build 330
- UT2003 v2225
- Halo
Synthetic Tests
3dMark2001SE build 330
3dMark2001SE was run at default setting – 1024×768 and NoAA (shown in the graph), along with 1024×768 and 4xAA, 1280×1024 and NoAA, and 1280×1024 and 4xAA. AA was set through the software.
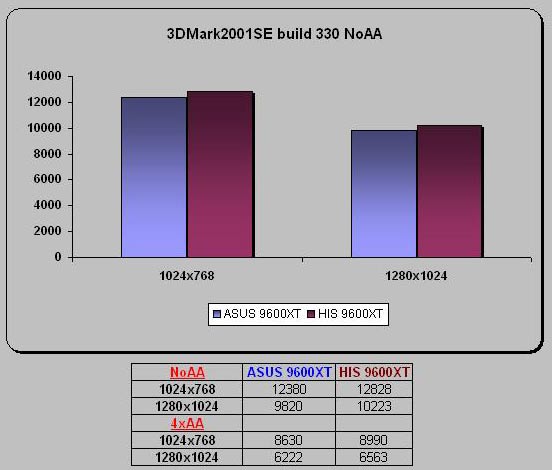
3DMark2001SE has shown the difference between the memory clock speeds of these two cards. The extra 50MHz in memory for the HIS card has caused it to have a slight lead all around in this test.
AquaMark3
AquaMark3 was run at 1024×768 with NoAA and 4xAA set through the driver.
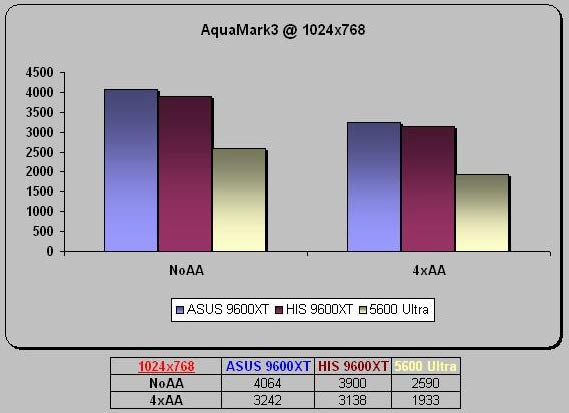
The extra memory speed on the HIS card does not seem to help in AquaMark3. And both 960)XT cards perform better than the 5600 Ultra in this test.
ShaderMark v2.0 build 1e
ShaderMark was run at 1024×768 with NoAA.
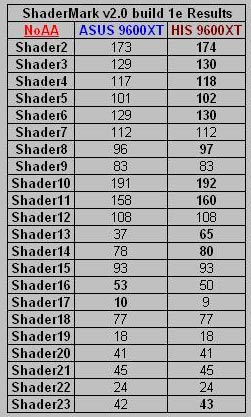
We can see that there really is no difference between these two 9600XT cards when using ShaderMark. However, there is one significant gap for Shader13, which is ‘Per pixel Shadowed Bump Mapping’.
D3D FableMark v1.0
FableMark is a quick little benchmark that is great for testing stencil edges. We tested the 9600XT’s at 1024×768 with NoAA and 4xAA/8xAF set through the driver.
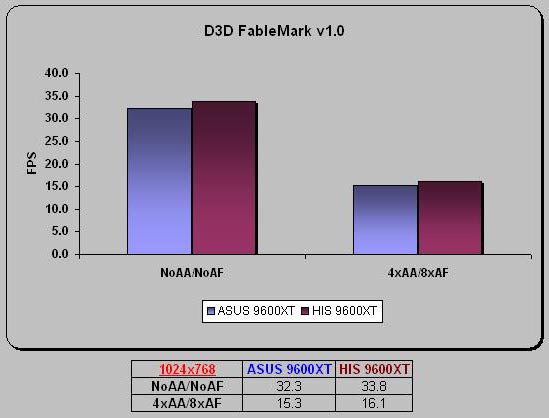
Once again, the two 9600XT cards perform the same, overall.
Fillrate Tester
Fillrate Tester was run using Display Mode 1024×768 @ 85Hz. No other changes to the settings were done.
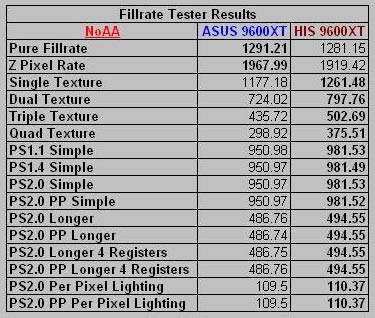
Here we can see that in most tests, there is a difference which would be caused by the difference in memory speeds. But overall, they perform roughly the same in this test.
Comments are closed.