Intel CPU Scaling on an AMD Radeon HD 7950 Video Card
Power Consumption, Power v Performance & Performance v Cost
For testing power consumption, we took our test system and plugged it
into a Kill-A-Watt power meter. For idle numbers, we allowed the system
to idle on the desktop for 15 minutes and took the reading. For load
numbers we measured the peak wattage used by the system while running
the OpenGL benchmark FurMark 1.9.2 at 640×480 resolution. We also ran the game Battlefield 3 and recorded the highest Wattage seen on the meter.
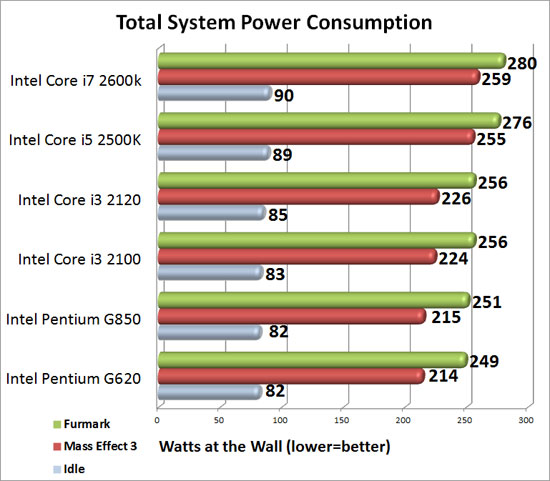
Power Consumption Results: Our results in the power consumption tests aren’t to shocking as we saw a 45 Watt difference in gaming from the slowest to the fastest processor. As you can see the faster the processor with more cores and cache, the higher the power consumption. We were a little surprised by the differences in the power consumption with Furmark 1.9.2. Since it is strictly a graphics card benchmark it doesn’t really utilize the processor to much.

We opened up Furmark 1.9.2 when we had the Intel Core i7 2600K set up in our system to check the processor utilization. We can that all of the activity is on the first core and Furmark has that core maxed out. This would explain the differences between the power consumption on the different processors and make these numbers kind of a moot point for our testing today as this is a single threaded application.
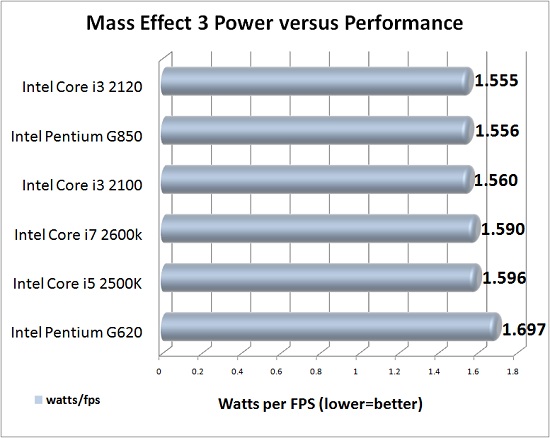
Power versus Performance Results: Since Mass Effect 3 scaled really well due to the fact it wasn’t GPU or CPU limited we used this game title to check out power versus performance. For this we took the peak Watts seen during gameplay and divided that number by the average frames per second we got. It shouldn’t come as too big of a shock that the fastest and slowest processors didn’t do too hot here. The processors that came out in the lead was the Intel Core i3-2120! If we would have only rounded to two decimal places the Intel Core i3-2100, Core i3-2100 and the Pentium G850 would have all been tied at 1.56 Watts per FPS.
/span>

Power versus Performance Results: This chart compares the price performance of the processors in relationship to the performance that we saw on Mass Effect 3. Higher results in the chart represent better value in terms of more performance per dollar. As you can see the Intel Pentium G620 with its small $67.85 price tag and respectable 126 FPS performance in Mass Effect 3 make it a very good value. The Intel Core i7-2600K is a great processor, but as you can see the the value really isn’t there for gaming.
The Intel Pentium G850 processor looks pretty good here as it came in second place in each of these three tests and is the overall winner win it comes to power usage and bang for the buck.
Comments are closed.