AMD’s 90nm Winchester CPU
Testing
All testing was done using following system in a controlled environment:
- ASUS A8V Deluxe v2.0 BIOS v.1008
- AMD 3500+ 90nm Winchester* and AMD 3500+ 130nm Newcastle*
- 1 GB Corsair TWINX1024- 4400 C25PT
- Sapphire X800 Pro
- Maxtor DiamondMax10 300 GB HDD
- Antec Sonata case w/ 480W Antec NeoPower PSU
- Thermalright’s XP-120 w/ Enermax 120mm fan
*All tests were run at stock speeds and again at 240 FSB. For performance and stress testing, the following programs were used: Sisoft Sandra’s CPU Arithmetic, CPU Multimedia, Memory Bandwidth, and Cache and Memory Test. 3D Mark 2005, Doom 3, Far Cry. Folding @ Home was used for 100% CPU usage to gain load temperatures.
All temperatures were recorded using ASUS PC Probe V2.23.01 in a 25C (+/- 1F) room. (Although no temperature probe is 100% accurate, they are good for reference when testing on the same motherboard, in the same environment.)
First, I needed to let the thermal paste settle to get an accurate temperature. To do this I let the Arctic Silver 5 cure for 10 days of 24/7 operation. During this time I played constantly with the system, trying to see if there was any difference at all between the 130 and 90nm processors. I ran all benchmarks with the multiplier set at 11 and the FSB at 200, then again at the best stable FSB I could maintain on my system, which ended up being 240 FSB.
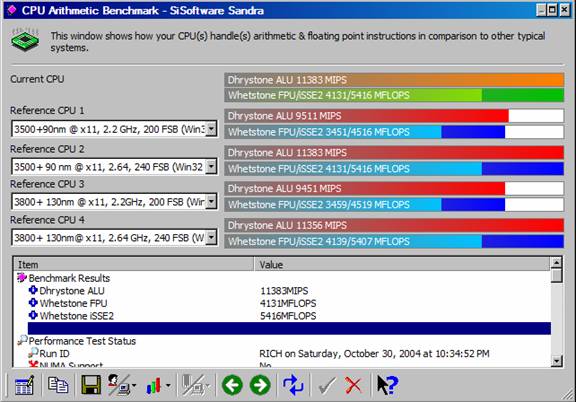
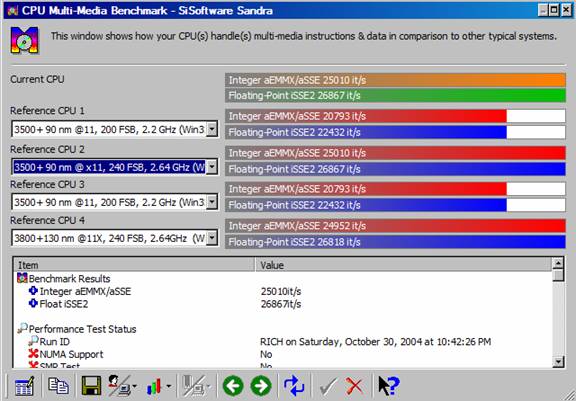
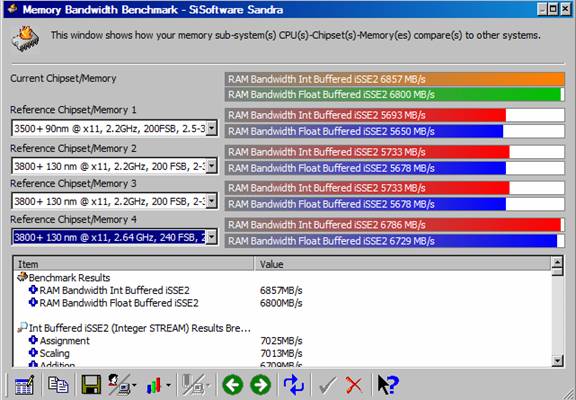
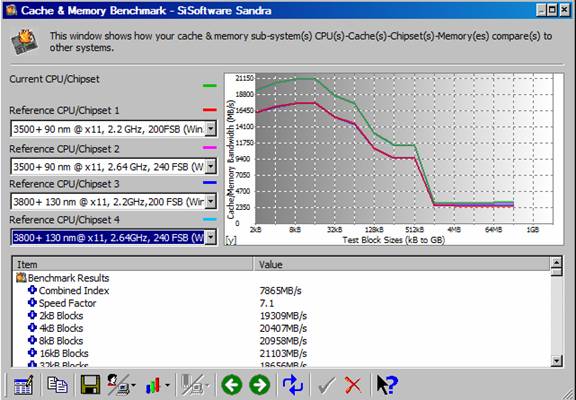
Nothing too spectacular here, maybe a 1-2% increase in performance overall. Next I ran Doom 3, Far Cry, and 3DMark05, although these are graphics intensive benchmarks, I wanted to see if there was any performance difference using the exact same system with the different processor.
| Benchmark | 90nm@200FSB | 90nm@240FSB | 130nm@200FSB | 130nm@240FSB |
| Far Cry (FPS) | 72.07 | 83.00 | 68.19 | 80.65 |
| Doom 3 (FPS) | 88.04 | 96.7 | 85 | 87 |
| 3DMark05 | 3695 | 3752 | 3680 | 3741 |
Again the 90nm Winchester slightly outperforms the Newcastle almost across the board.
So, here at last we look at what makes the Winchester different from both its 130nm cousin as well as Intel’s 90nm Prescott: the temperatures.
| 130nm @1.5V 200FSB | Idle-37C Load-45C |
| 90nm @1.4V 200FSB | Idle- 32C Load- 40C |
| 130nm @1.55V 240FSB | Idle- 40C Load- 52C |
| 90nm @1.44V 240FSB | Idle- 33C Load- 42C |
Although the performance of the 90nm Winchester is roughly the same as the Newcastle’s, the temperatures are significantly lower across the board. While I saw a 5C difference at stock speeds, there was a 10C difference at 240FSB on the 3500+, that’s 42C@ 2.64GHz, on air! In my opinion nothing short of amazing considering the issues with 90nm technology to date.
Comments are closed.