Intel Core i3-2120 3.3GHz Sandy Bridge Processor Review
Cinebench R11.5
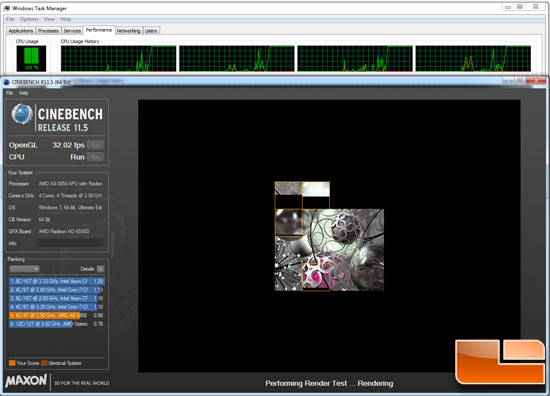
MAXON; CINEBENCH R11.5:
MAXON recently released CINEBENCH Release 11.5, an advanced hardware
testing suite that assesses a computer’s performance capabilities.
CINEBENCH is based on the same powerful technology as MAXON’s
award-winning animation software CINEMA 4D, which is used extensively by
studios and production houses worldwide for 3D content creation. The
new version of CINEBENCH includes the ability to more accurately test
the industrys latest hardware, including systems with up to 64
processor threads, and the testing environment better reflects the
expectations of todays production demands. A more streamlined interface
makes testing systems and reading results incredibly straightforward.
Again, higher Frames/Second and point score equal better performance.
Cinebench R11.5 was able to put a 100% load across all the cores on
all of the processors, which makes this a great benchmark to look at
multi-core platforms.
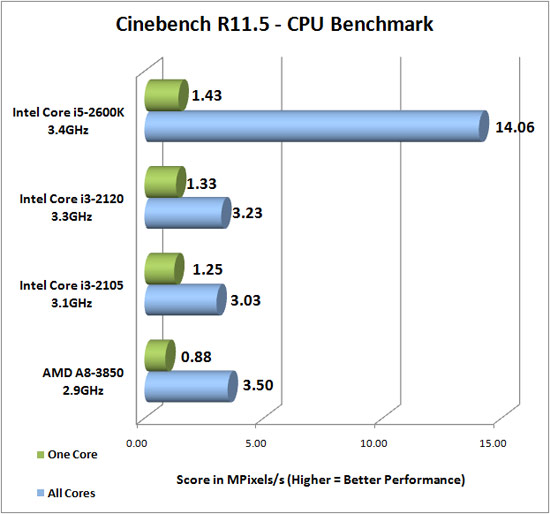
Benchmark Results: The Intel Core i5-2600K dominates the other processors when all available cores/threads are used on the benchmark, but with just a single CPU core used you can see that clock frequency plays a major roll here.
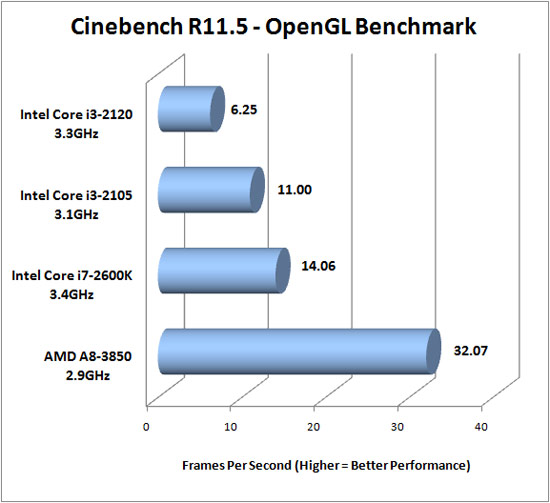
Benchmark Results: Up to this point we have only run x86 CPU benchmarks, so this will be the first GPU benchmark for these four processors. As you can see the AMD A8-3850 takes the lead for the first time today thanks to the powerful AMD Radeon HD 6550D GPU inside the APU. The Intel Core i7-2600K and the Core i3-2105 feature Intel HD Graphics 3000 GPU’s running at 850MHz, while the Core i3-2120 uses the Intel HD Graphics 2000 GPU running at 850MHz. Since the Intel Core i3-2120 uses the older GPU the performance falls short of what is capable on Intel HD Graphics 3000 and as you can see from the results above the performance difference is rather large!
Comments are closed.